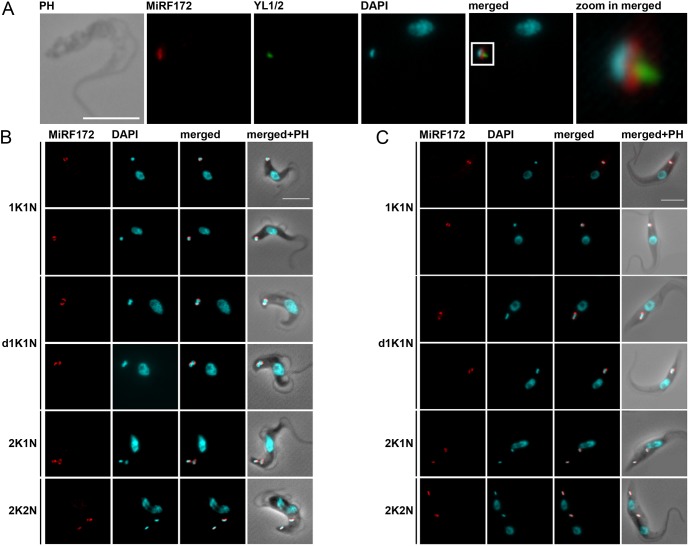
Fig. 2.
Localization of MiRF172 in BSF and PCF T. brucei cells. (A) Immunofluorescence microscopy of MiRF172–PTP-expressing BSF cells. The localization of MiRF172–PTP (red) is represented by maximum intensity projections from immunofluorescence microscopy image stacks of T. brucei BSF cells. MiRF172–PTP was detected by means of the anti-Protein A antibody. The mature basal bodies were detected with the YL1/2 monoclonal antibody (green). The kDNA and the nucleus were stained with DAPI (cyan). (B) Immunofluorescence analysis of MiRF172–PTP during different stages of the cell cycle (1K1N, dK1N, 2K1N, 2K2N) in BSF cells. K, kDNA; N, nucleus; dK, duplicating kDNA. Localization of MiRF172–PTP (red) and DNA (cyan) were performed as described in A. (C) Immunofluorescence analysis of MiRF172–HA during different stages of the cell cycle (1K1N, dK1N, 2K1N, 2K2N) in PCF cells. The localization of MiRF172–HA (red) is represented by maximum intensity projections from immunofluorescence microscopy image stacks of PCF cells. MiRF172–HA was detected with anti-HA antibody. The kDNA and the nucleus were stained as described in A. PH, phase contrast. Scale bars: 5 µm.

