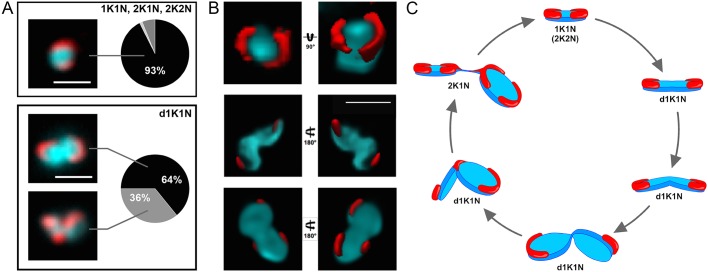
Fig. 3.
Analysis of MiRF172 localization during the cell cycle. (A) Quantification of MiRF172–PTP localization at single or duplicated kDNA discs (1K1N, 2K1N, 2K2N) and duplicating kDNA discs (d1K1N) in BSF cells (ntotal=240). K, kDNA; dK, duplicating kDNA; N, nucleus. The left side shows representative immunofluorescence microscopy images depicting the localization of MiRF172–PTP (red) relative to the kDNA disc (cyan). The pie charts show the percentage localization of MiRF172 in the respective kDNA replication stage. (B) 3D-STED immunofluorescence analysis of MiRF172–PTP in T. brucei BSF cells. An MiRF172 (red) and kDNA (cyan) 3D projection (surface rendering) from different angles is shown. MiRF172-PTP was detected with the anti-Protein A antibody and images acquired by 3D-STED microscopy. The kDNA was stained with DAPI (cyan) and images acquired by confocal microscopy. Pictures were deconvolved with the Huygens professional software. (C) Model of MiRF172 localization during the cell cycle. Depicted is a model of the different stages of kDNA disc (cyan) replication in T. brucei and the localization of MiRF172 (red) relative to the kDNA. Scale bars: 1 µm.

