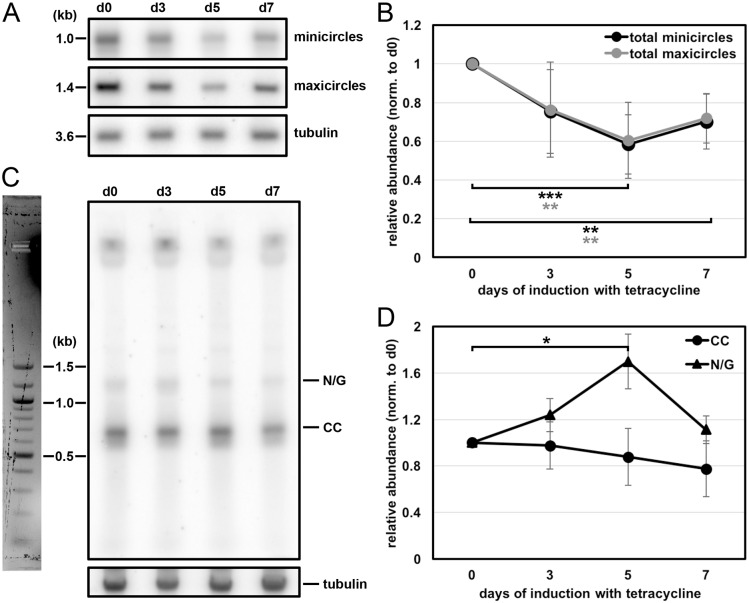
Fig. 5.
Effect of MiRF172 RNAi on the kDNA abundance and free minicircle replication intermediates in T. brucei BSF cells. (A) Detection of total minicircles and maxicircles by Southern blotting. Total DNA, digested with HindIII and XbaI, from either uninduced [day (d)0] or RNAi induced (d3, d5, d7) cells was used. This was probed for minicircles (detection of 1.0-kb linearized minicircles), maxicircles (detection of a 1.4-kb fragment), and tubulin, as a loading control (detection of a 3.6-kb fragment). (B) Quantification of minicircle and maxicircle abundance on Southern blots during MiRF172 depletion (n≥6 for each time point). Black, minicircles; gray, maxicircles. The ratio of the abundance of total minicircle or maxicircle relative to the loading control (tubulin), normalized to day 0 of RNAi induction, is shown. **P≤0.01, ***P≤0.001 (gray values are for minicircles, and black for maxicircles). (C) Detection of free minicircle replication intermediates by Southern blotting. Total DNA isolated from either uninduced (d0) or RNAi induced (d3, d5, d7) cells was Southern blotted, and probed for minicircles. N/G and CC minicircles are indicated. Tubulin was used as a loading control. (D) Quantification of CC and N/G minicircles, as determined by Southern blotting, during MiRF172 depletion (n≥6 for each time point). Black circles, CC minicircles, black triangles, N/G minicircles. The ratio of the abundance of minicircles relative to the loading control tubulin and normalized to day 0 of RNAi induction is shown. *P<0.05.

