Fig. 7.
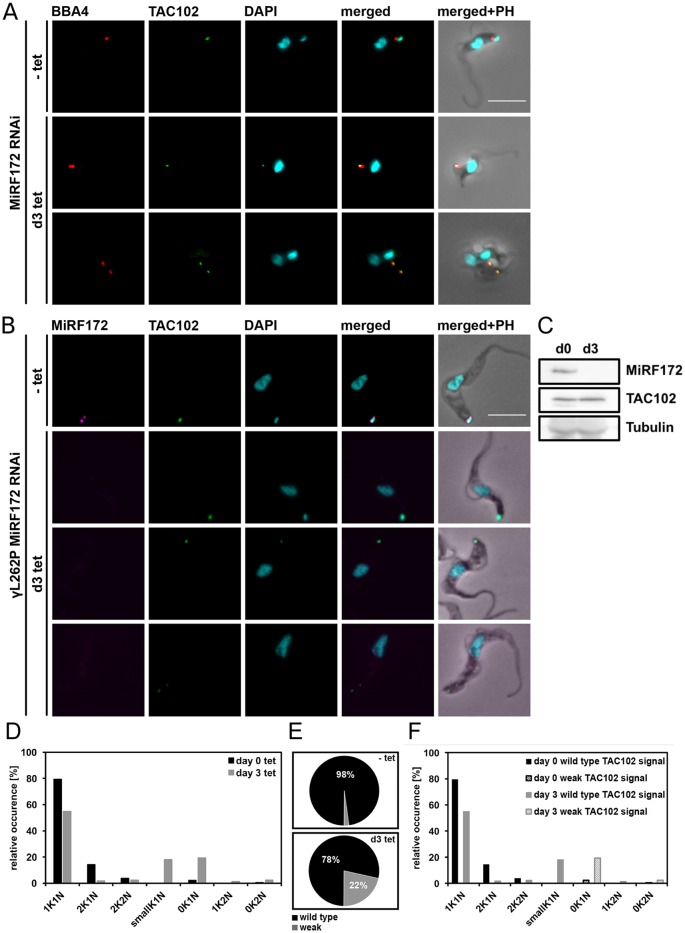
Quantification of TAC102 in MiRF172 RNAi BSF cells. (A) MiRF172 RNAi BSF cells stained for TAC102 (green) and basal bodies (red) from either uninduced (-tet) or RNAi induced [day (d)3] cells. Pictures show maximum intensity projections from immunofluorescence microscopy image stacks of MiRF172 RNAi BSF T. brucei cells. TAC102 was detected with the anti-TAC102 polyclonal rat antibody and the basal bodies with the monoclonal mouse antibody BBA4. The kDNA and the nucleus were stained with DAPI (cyan). (B) γL262P MiF172 RNAi BSF cells stained for MiRF172–PTP (magenta), TAC102 (green), basal bodies (red) and DAPI (cyan). Proteins and DNA were detected with the same antibodies and reagents as in A. MiRF172–PTP was detected with the anti-Protein A antibody. The pictures show maximum intensity projections as in A. (C) Western blot analysis of γL262P MiRF172 RNAi BSF cells. Total protein isolated from uninduced cells (d0) and cells induced with tet for 3 days (d3). C-terminally PTP-tagged MiRF172 was detected with an anti-PAP antibody and TAC102 with the anti-TAC102 monoclonal mouse antibody. Tubulin serves as a loading control. (D) Quantification of the relative occurrence of kDNA discs and nuclei in γL262P MiRF172 RNAi induced and uninduced cells (n≥180 for each time point). K, kDNA; N, nucleus. (E) Quantification of TAC102 in γL262P MiRF172 RNAi uninduced (−tet) and cells induced for three days with tet (d3 tet). Black represents the wild-type TAC102 signal and gray stands for a weak TAC102 signal. (F) Quantification of the relative occurrence of the TAC102 signal in γL262P MiRF172 RNAi cells with different kDNA and nucleus DNA content. PH, phase contrast. Scale bars: 5 µm.

