Figure 1.
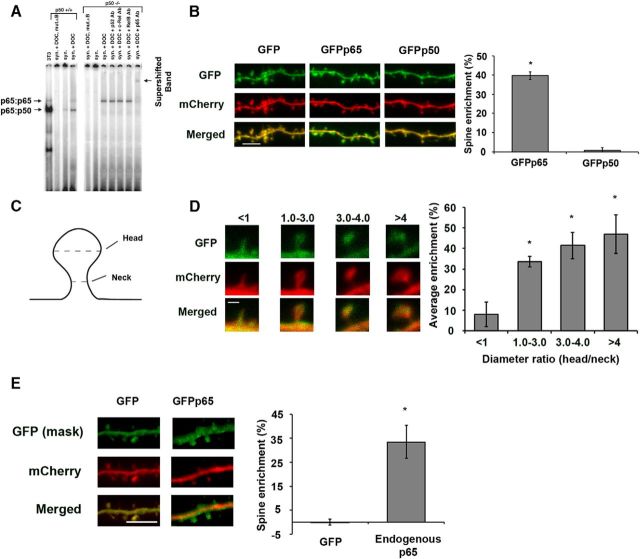
p65 is sufficient for NF-κB enrichment in dendritic spines of hippocampal pyramidal neurons. A, EMSA from synapses isolated from wild-type (p50+/+) or p50-deficient (p50−/−) murine hippocampi. NF-κB was detected using a radiolabeled oligonucleotide κB probe and specific subunits identified by antibody-supershifted bands. DOC was used to allow detection of occult (inactive) NF-κB. p65:p65 homodimers detected in p50−/− isolated synapses from all (4) biological replicates of the experiment. B, Confocal images of live DIV17 hippocampal neurons coexpressing mCherry with GFP, GFPp65, or GFPp50, as indicated. Graph represents percentage enrichment of GFPp65 or GFPp50, relative to GFP, as described in Materials and Methods. Scale bar, 5 μm. Error bars indicate SEM. *p = 3.8 × 10⁻¹⁰. C, Diagram representing spine measurements. Dashed lines indicate diameter. D, Analysis of spine maturity from dendrites expressing GFPp65. Percentage enrichment of GFPp65 in dendritic spines is calculated and binned according to spine size. Spine size was determined by a ratio of the spine head diameter to the spine neck diameter. Scale bar, 1 μm. Error bars indicate SEM. *p values compared with enrichment for spines <1 are as follows: for 1–3, p = 0.004; for 3 or 4, p = 0.002; for >4, p = 0.003. E, Confocal images of hippocampal pyramidal neurons coexpressing GFP and mCherry (left) or expressing mCherry fluorescent protein and GFPp65 from the endogenous RelA locus (right) and immunostained for GFP and mCherry. Graph represents percentage enrichment of GFP and endogenously expressed GFPp65. Scale bar, 5 μm. Error bars indicate SEM. *p = 1.4 × 10⁻⁵.

