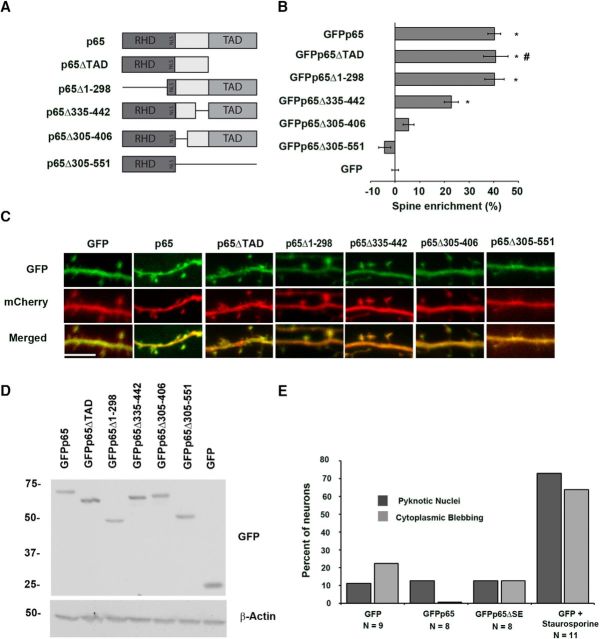
Figure 2.
Identification of non–spine-enriched mutants of p65. A, Diagram of p65 and p65 deletion and truncation constructs. B, Graph showing percentage enrichment of GFP-tagged p65 and GFP-tagged p65 deletion and truncation constructs. Enrichment is determined as described in Materials and Methods. Error bars indicate SEM. *p values compared with GFP condition are as follows: for GFPp65, p = 2.5 × 10⁻³⁰; for GFPp65Δ1–298, p = 4.7 × 10⁻¹⁵; for GFPp65Δ335–442, p = 9.5 × 10⁻⁸. #Data from GFPp65ΔTAD condition were previously presented (Boersma et al., 2011) in a different format. C, Representative confocal images from live murine hippocampal neurons coexpressing mCherry with GFP-tagged p65 deletion or truncation constructs or wild-type p65. Scale bar, 5 μm. D, p65 constructs were expressed in 293T cells at equivalent levels and migrate at their expected molecular weights by immunoblot of lysates. Expected molecular weights (kDa) are as follows: GFPp65, 87; GFPp65ΔTAD, 76; GFPp65Δ1–298, 53; GFPp65Δ1002–1326, 76; GFPp65Δ916–1218, 76; GFPp65Δ305–551, 62; GFP, 27. E, Expression of p65 constructs does not significantly alter measures of neuronal health. Percentage of neurons scoring positive in confocal imaging for cytoplasmic blebbing/beading or for pyknotic nuclear morphology using Hoechst staining from hippocampal neurons coexpressing mCherry with GFP, GFPp65, or GFPp65ΔSE. Staurosporine treatment of GFP-expressing neurons serves as a positive control; experimenter was blinded to condition during all imaging and analysis. Cells were scored as positive or negative (see Materials and Methods) and percentage positive plotted per condition (precluding SEM calculation).

