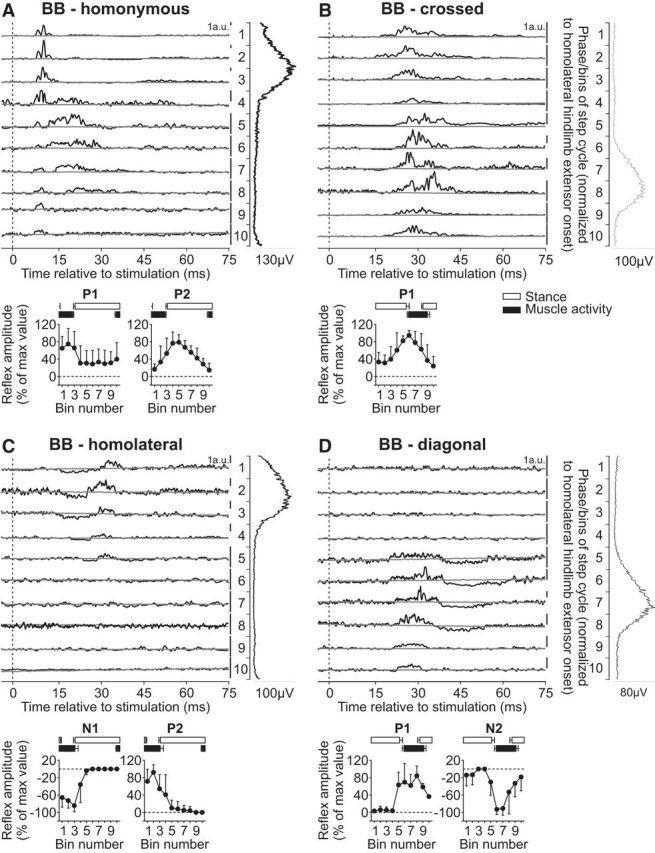
Figure 6.

Intralimb and interlimb cutaneous reflexes in BB. SR nerve stimulations evoked (A) homonymous (6 trials in 4 cats) and (B) crossed responses (5 trials in 3 cats), whereas SP nerve stimulations evoked (C) homolateral (5 trials in 3 cats) and (D) diagonal (3 trials in 2 cats) responses in the BB. Each panel represents averaged waveforms in the 10 bins of the cycle with a window of 80 ms that starts 5 ms before stimulation in a single cat. Black traces represent averaged cycles that received a stimulation (i.e., reflex responses, n = 6–22 stimuli per bin). Gray traces represent averaged cycles with no stimuli (n = 83–146 cycles). Scale bars are shown in arbitrary units (a.u.) for each bin and can differ to optimize evoked responses. Aligned vertically is the average rectified EMG trace of the BB muscle over the cycle normalized to a hindlimb extensor on the side of the stimulation. Scatter plots represent reflex amplitudes (mean ± SD) in each bin of the cycle expressed as a percentage of the maximal response found in one of the bins for pooled data. Short-latency (P1/N1) and mid-latency (P2/N2) responses are shown separately.
