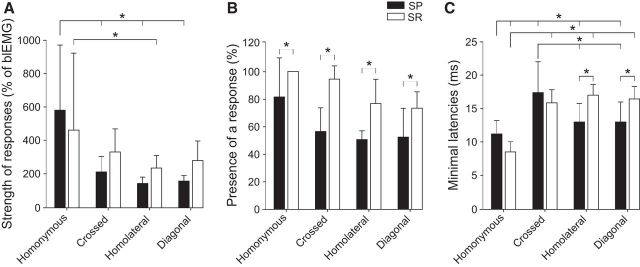
Figure 9.
Relative strengths, presence, and latencies of reflex responses. A, For each type of response evoked by SP or SR nerve stimulation, the amplitude of the first evoked excitatory response (P1 or P2) was expressed as a percentage of the control background level of activity during the muscle's peak period of activity. These data were pooled for each type of response evoked by SP and SR nerve stimulation. B, The percentage of trials where any type of response was observed in a given muscle was measured. Data were pooled for each type of response evoked by SP and SR nerve stimulation. C, The latencies of the first observed homonymous, crossed, homolateral, and diagonal responses were measured for each muscle. Data were pooled for each type of response evoked by SP and SR nerve stimulation. A–C, Error bar indicates mean ± SD of pooled data. *p < 0.05, significant differences between responses evoked by SP and SR nerve stimulation.

