Figure 3.
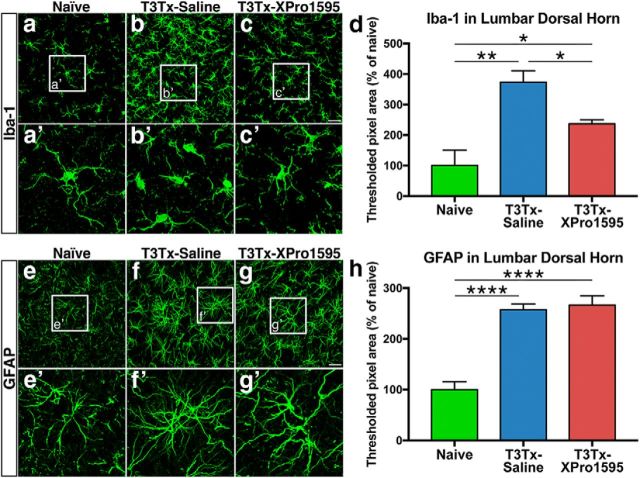
Inhibiting sTNFα/TNFR1 dampens microglial reactivity but does not reduce astrocytic gliosis. a–c, Representative confocal images of immunostaining of Iba-1+ microglia in lumbar spinal cord from naive, uninjured animals or T3Tx animals 4 weeks after SCI that were treated with either saline or XPro1595 (n = 3 per group). In naive animals, Iba-1+ microglia took on a highly ramified morphology typical of resting microglia (a, a′). There was significantly more Iba-1+ immunoreactivity in tissue from T3Tx-saline animals (d). The Iba-1+ microglia in these animals had short processes and took on the phenotype of more reactive cells (b, b′). Iba-1+ immunoreactivity in T3Tx-XPro1595 animals were less than their saline-treated counterparts but also were greater than naive levels (c, c′, d). e–g, Representative confocal images of immunostaining of GFAP+ astrocytes in lumbar spinal cord from naive, uninjured animals or T3Tx animals 4 weeks after SCI that were treated with either saline or XPro1595 (n = 4 per group). Higher magnification images of the boxed regions in e–g are shown in e′–g′. Astrocytes in naive animals show morphology typical of a resting astrocyte (e). T3Tx resulted in significantly more GFAP+ immunoreactivity, regardless of treatment (f–h). The GFAP+ astrocytes in both T3Tx-saline and -XPro1595 animals appeared hypertrophic and took on a phenotype typical of more reactive astrocytes (f, g). There was no difference in GFAP+ immunoreactivity between treatment groups (h). Data are mean ± SEM. *p < 0.05 (one-way ANOVA and post hoc Fisher's LSD test). **p < 0.01 (one-way ANOVA and post hoc Fisher's LSD test). ****p < 0.0001 (one-way ANOVA and post hoc Fisher's LSD test). Scale bars: a–c, 37.5 μm; e–g, 25 μm.

