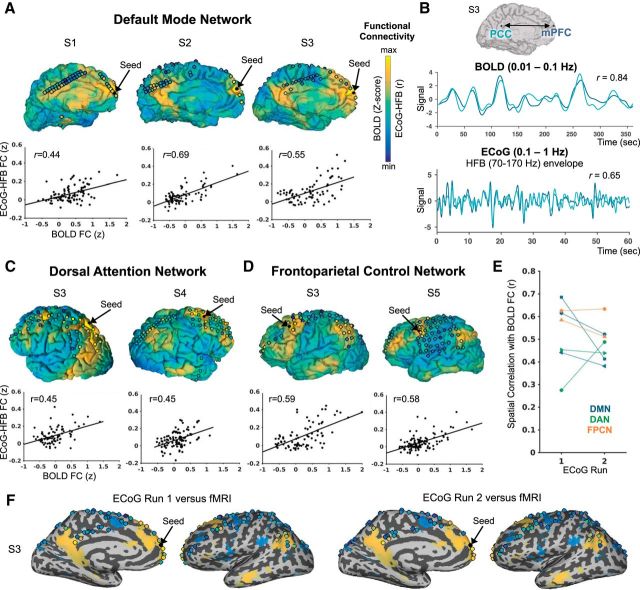
Figure 1.
Correspondence of seed-based functional connectivity between resting state BOLD and ECoG (HFB envelope) within 5 subjects (S1–S5). On the cortical surface projections, the seed electrode location is shown as a black dot. Other electrode locations are shown as circles filled with a color representing the degree of ECoG-HFB envelope correlation with the seed (from one representative ECoG run). The degree of BOLD correlation with the seed (expressed as Z-score from a general linear model analysis) is shown on the pial surface. Color scales are anchored at minimum and maximum r values and Z-scores for ECoG and BOLD, respectively (disregarding electrodes immediately neighboring the seed in ECoG). In A), C), and D), respectively, individual results are shown from seed locations within the default mode network (DMN), dorsal attention network (DAN), and frontoparietal control network (FPCN), including scatter plots of the spatial correlation between ECoG versus BOLD seed-based functional connectivity across target electrode locations (unanalyzed electrodes not shown). B) Example BOLD and ECoG-HFB envelope time courses extracted from the medial prefrontal cortex (mPFC) and posterior cingulate cortex (PCC) within the DMN. E) Reproducibility of the relationship between BOLD and ECoG functional connectivity across two independent ECoG resting state runs (each subject indicated with a different marker shape, and each network labeled with a different color). F) An example of BOLD versus ECoG-HFB connectivity of the mPFC on the inflated medial and lateral surfaces for two independent ECoG runs (patient S3, BOLD FC thresholded at Z-score > |10|).

