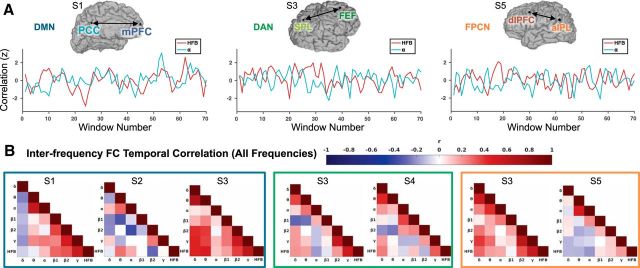
Figure 7.
Dynamic ECoG functional connectivity within intrinsic networks. A) Sliding-window correlations between activity measured during wakeful rest at electrodes in the default mode network (DMN), dorsal attention network (DAN) and frontoparietal control network (FPCN) in three example subjects, respectively. For HFB and alpha envelope signals (0.1–1 Hz filtered), the correlation (Fisher r-to-z transformed) between electrodes is plotted in 10-second windows (5 second step size between adjacent windows). B) Inter-frequency correlations of dynamic functional connectivity. Between all pairs of frequencies, correlations between 10-second sliding window functional connectivity estimates (with 5-second step size) are shown. Results are shown for all subjects for within-network region pairs in the default mode (left, blue box), dorsal attention (middle, green box), and frontoparietal control (right, orange box) networks. Frequencies shown include δ (1–3 Hz), θ (4–7 Hz), α (8–12 Hz), β1 (13–29 Hz), β2 (30–39 Hz), γ (40–70 Hz) and HFB (70–170 Hz). aIPL = anterior inferior parietal lobule; dlPFC = dorsolateral prefrontal cortex; FEF = frontal eye fields; mPFC = medial prefrontal cortex; PCC = posterior cingulate cortex; SPL = superior parietal lobule.

