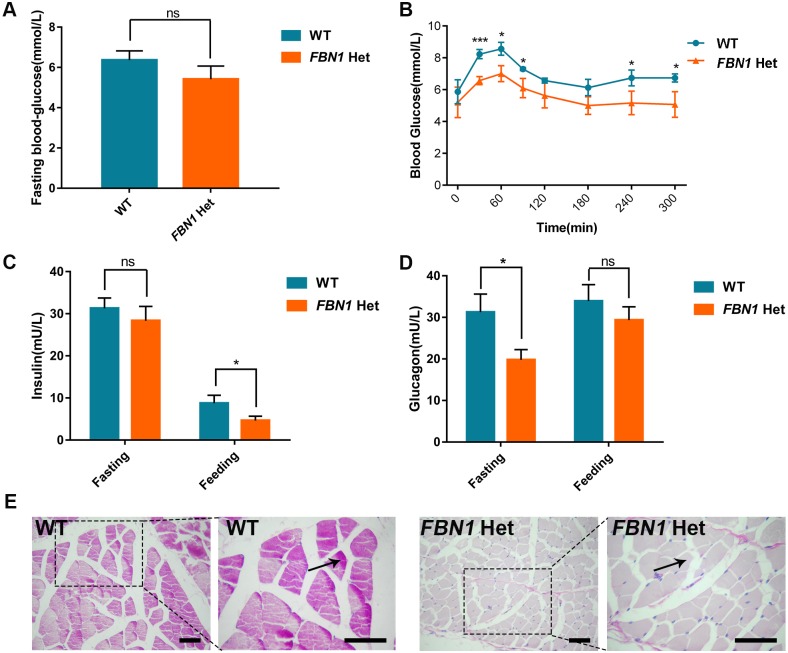
Fig. 8.
Abnormal glucose metabolism in FBN1 Het rabbits. (A) Fasting blood-glucose (FBG) showing maintained euglycemia in the FBN1 Het rabbits compared with the WT controls after 12 h fasting. (B) Glucose tolerance test (GTT) showing that FBN1 Het rabbits have decreased ability to metabolize blood glucose compared with WT controls. (C) Serum ELISA assay showing lower insulin levels in FBN1 Het rabbits after feeding. (D) Serum ELISA assay showing lower glucagon levels in FBN1 Het rabbits after fasting. (E) PAS stain showing defect of glycogen deposition (arrow) in the skeletal muscle of FBN1 Het rabbits. Data are presented as mean±s.e.m. and analyzed using Student's t-tests with GraphPad Prism software 6.0. *P<0.05; ***P<0.001. n=6. Scale bars: 50 μm.

