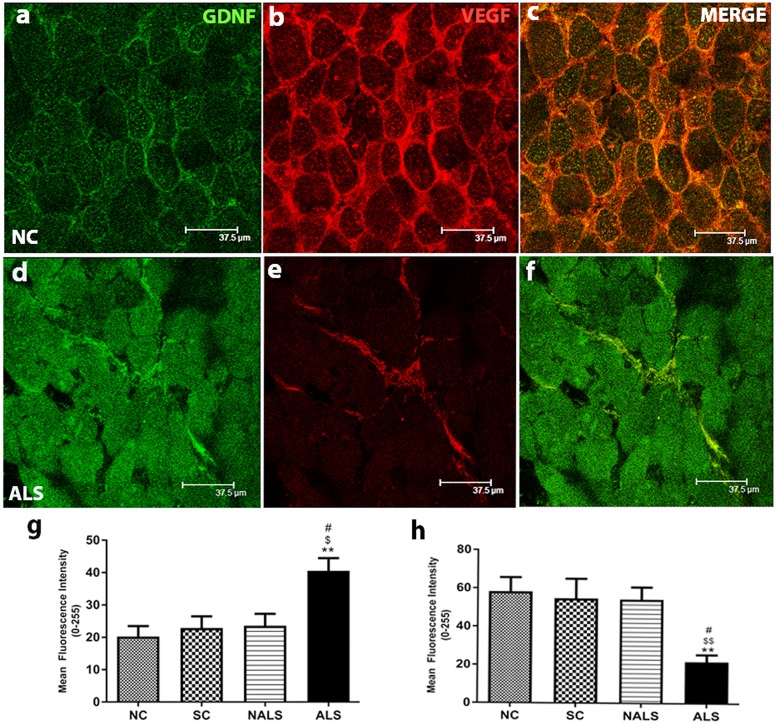
Fig. 6.
Upregulated GDNF and downregulated VEGF expression. (A-F) Representative photomicrographs of transverse muscle sections stained for GDNF (FITC) and VEGF (CY-3), showing altered expression. Increased and decreased expression of GDNF and VEGF, respectively, was seen in the muscle of ALS rats. Scale bars: 37.5 μm. (G,H) Quantification of immunofluorescence intensity supported the qualitative observations. GDNF showed a significant upregulation (G, **P<0.01, NC versus ALS; $P<0.05, SC versus ALS; #P<0.05, NALS versus ALS), whereas VEGF showed a significant downregulation (H, **P<0.01, NC versus ALS; $$P<0.01, SC versus ALS; #P<0.05, NALS versus ALS), in the ALS group compared with the other groups. n=5 in duplicates. Data were analysed using one-way ANOVA followed by Tukey's post hoc test.

