. 2018 May 22;7:e32100. doi: 10.7554/eLife.32100

Figure 2. Perception of social interaction shortens subjective duration.

(A) Proportion of responses in which observers reported a communicative motion sequence as longer in duration than a noncommunicative one, plotted as a function of the physical duration difference between the two. Data are shown for the upright (solid curve) and the inverted (dashed curve) conditions in Experiment 1. Inset shows the PSEs. A PSE of 0 indicates a consistency between subjective duration and physical duration. (B-C) Psychometric functions for Experiments 2 and 3 where a temporally delayed version (B) and a spatially swapped version (C) of the motion sequences in Experiment 1 were respectively used. In both cases, the strengths of the spatial-temporal correlations between acting agents were unaltered but the communicative intentions were disrupted. (D) The PSEs for the upright condition versus the PSEs for the inverted condition for individual observers in Experiments 1 (red dots), 2 (blue squares) and 3 (lime triangles). A slope of 1 (dashed diagonal line) represents comparable PSEs for the upright and the inverted conditions. Error bars: standard errors of the mean; ***p<0.001.

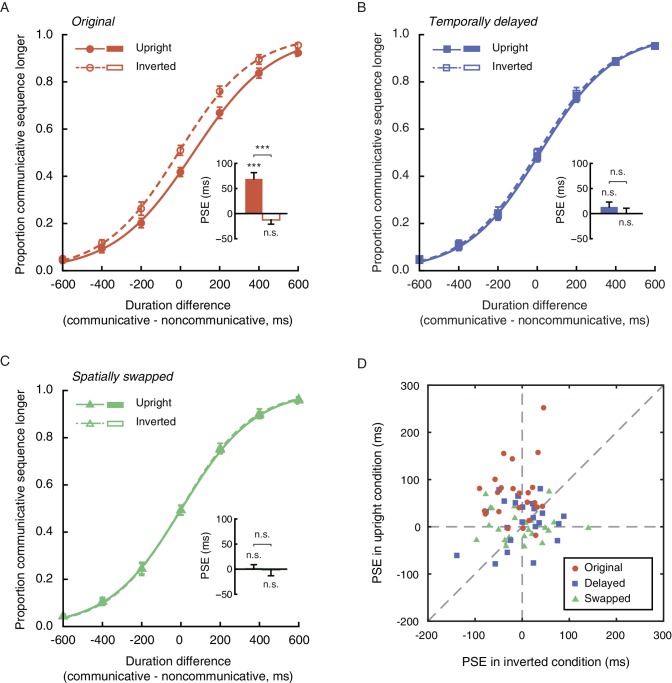
Figure 2.

Figure 2—figure supplement 1. Supplementary Experiment.

Figure 2—figure supplement 1.

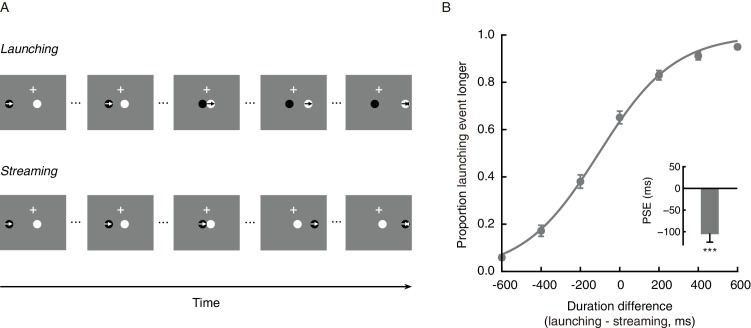
(A) The visual stimuli consisted of two small discs (black and white, each subtending 1.1°) drawn on a gray background. The black disc started out at a random location between 9.5° and 14.3° horizontally to the left or the right of fixation and the white disc started out with one of its edges (that closest to the black disc) vertically aligned with the fixation point (0.6°×0.6°). Both discs were positioned 2.8° vertically below fixation. In a launching event (upper panel), the black disc moved toward the white disc at a random speed between 5.9°–35.6°/s, stopped when the two discs became adjacent, and the white disc instantly started moving at the same speed and direction (toward the other edge of the display). It was typically perceived as ‘causal’, namely, the arrival of one moving object caused the motion of the other object. In a streaming event (lower panel), the black disc moved toward the white disc at a random speed between 5.9°– 35.6°/s, overlapped completely with the white disc, and continued moving at the same speed and direction while the white disc remained stationary. This was typically perceived as ‘noncausal’, that is, one moving object simply streamed past another stationary object. The experimental procedure was otherwise identical to that of the main experiments. There were 42 trials in each block and a total of 4 blocks. Arrows indicate motion directions of the discs. (B) Proportion of responses in which observers reported a launching event as longer in duration than a streaming event, plotted as a function of the physical duration difference between the two. The mean PSE across 24 participants (12 females; mean age ±SD = 22.8±3.3 years) was −105.8 ms, significantly below 0 (t23 = −5.78, p<0.001, Cohen’s d = −1.18; inset), that is, a ‘causal’ launching event dilated subjective duration such that it needed to be 105.8 ms shorter to be perceived as equal in duration to a ‘noncausal’ streaming event. This was in sharp contrast to the temporal compression effect of perceived social interactions observed in Experiment 1. Error bars: standard errors of the mean; ***p<0.001.