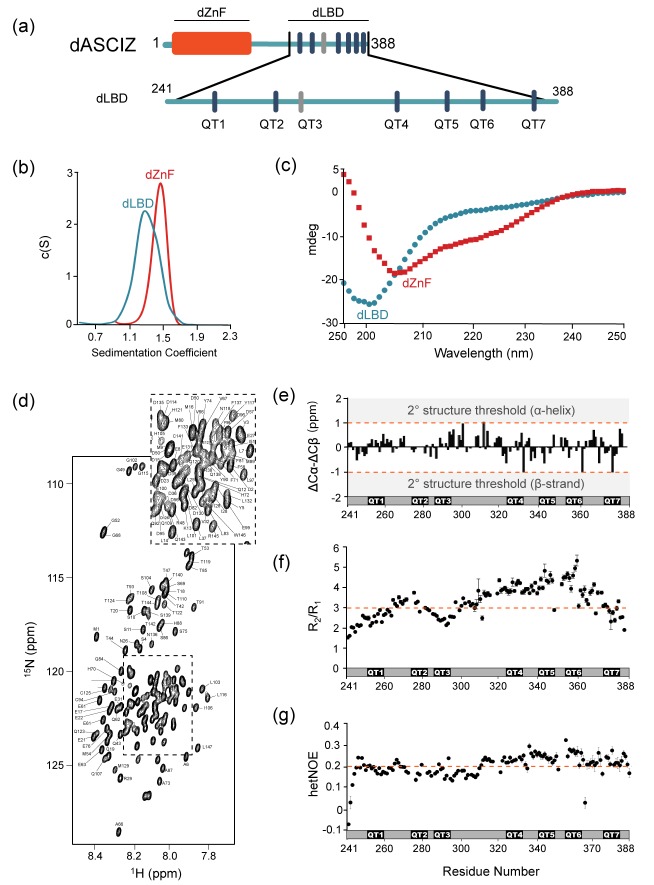
Figure 2. Domain structures of dASCIZ.
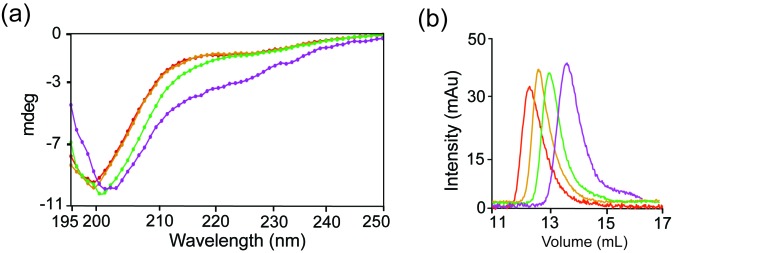
(a) Domain structure of dASCIZ, showing the dZnF domain (red) and 7 LC8 binding motifs in its C-terminal domain (blue). Dark blue bars indicate predicted TQT motifs and gray bars indicate the TMT motif (QT3) identified in this study. (b) Sedimentation velocity analysis of the dZnF domain (red), collected at 10°C, and the dLBD (blue), collected at 25°C. (c) Far UV CD spectrum of the ZnF domain (red squares) and the dLBD (blue circles), both collected at 10°C. (d) [15N−1H]-BEST-TROSY spectrum at 850 MHz showing backbone assignments for 133 non-proline residues. Unassigned peaks correspond to the two additional N-terminal residues from the expression vector. The spectrum was recorded at 10°C. (e) A plot of secondary chemical shift differences versus residue number. ΔCα and ΔCβ values were calculated by subtracting the random coil chemical shifts (Tamiola et al., 2010) from the experimentally determined. ΔCα − ΔCβ values < ±1.0 ppm are considered not significant. (f) Plots of R2/R1 and (g) heteronuclear NOE values measured at 10°C indicate high level of disorder. A dotted line is placed at the average value to aid in visualization. Segments corresponding to LC8 recognition motifs, QT1, QT2, QT3, QT4, QT5, QT6, and QT7 are shown. Additional structural characterization of the dLBD by circular dichroism and gel filtration chromatography is shown in Figure 2—figure supplement 1.


