Figure 6. NMR titration of the dLBD with LC8.
Relative intensities of non-proline NH peaks in 15N-13C-HNCO spectra are shown for (a) dLBD, (b) QT2-4, and (c) QT4-6 titrated with LC8 at molar ratios of 1:0.25, 1:1, 1:2, 1:5, and 1:8. Peak intensities (I) are given relative to the intensity of the same peak in free peptide (I0). Above (a) are 1D NMR slices of representative amino acids from TQT motifs QT1 (T261), QT3 (T294), QT4 (T332), QT7 (T382) and a control (S244). Representative slices of HNCO spectra from multiple titration points are shown in Figure 6—figure supplement 1. (d–g) The I/I0 data are alternatively plotted as the average intensity ratio for each 10-amino acid motif versus the molar ratio of dLBD:LC8. For the dLBD complex, titration curves of individual motifs cluster in two groups having higher (d) or lower (e) average intensity ratios at the same dLBD:LC8 molar ratio. Similarly, for the two shorter constructs, plots of average I/I0 for individual motifs cluster in two groups, motifs in QT2-4:LC8 having higher intensity ratios (f), and motifs in QT4-6:LC8 having lower intensity ratios (g). Motif designations in (d) and in (f) are: QT1 (triangle), QT2 (square), QT3 (diamond). Motif designations in (e) and (g) are: QT4 (triangles), QT5 (squares), QT6 (diamond), and QT7 (circle). Note that complete peak attenuation at any titration point is given a value of 0 (Figure 6g). In (d) values are shown for a negative control group (crosses, dotted line) comprised of those measurable at saturating LC8 concentration in the first eight amino acids, 241–249. In panels (d–g), solid curves are to guide the eye.
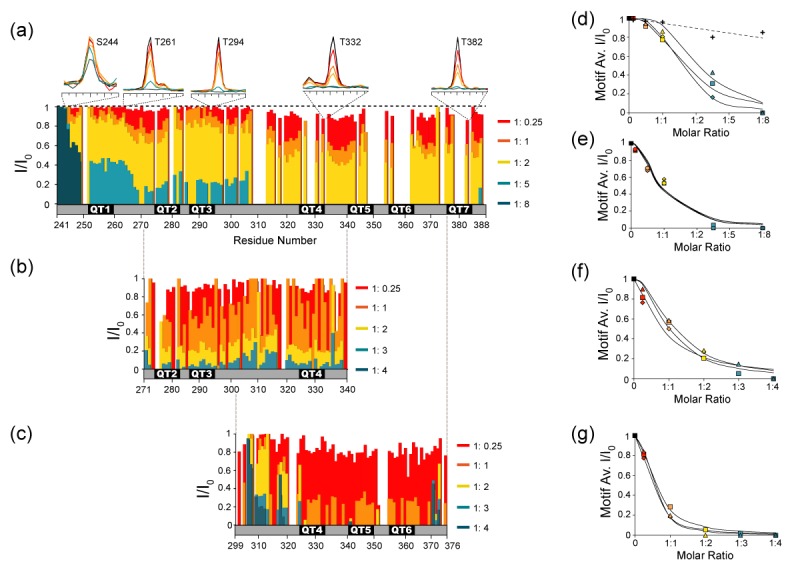
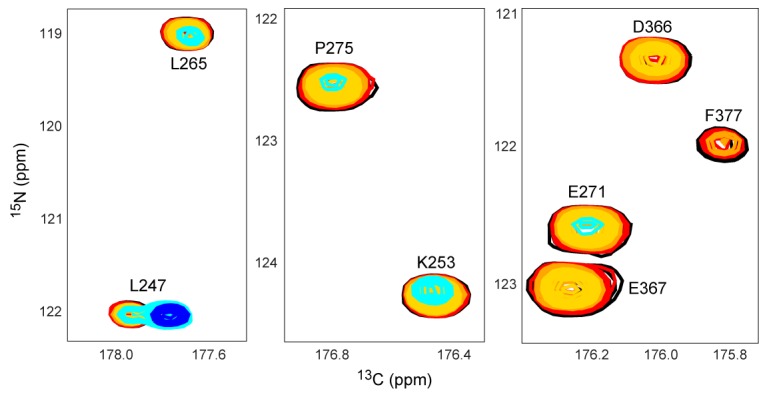
Figure 6—figure supplement 1. Representative HNCO slices of dLBD titration with LC8.