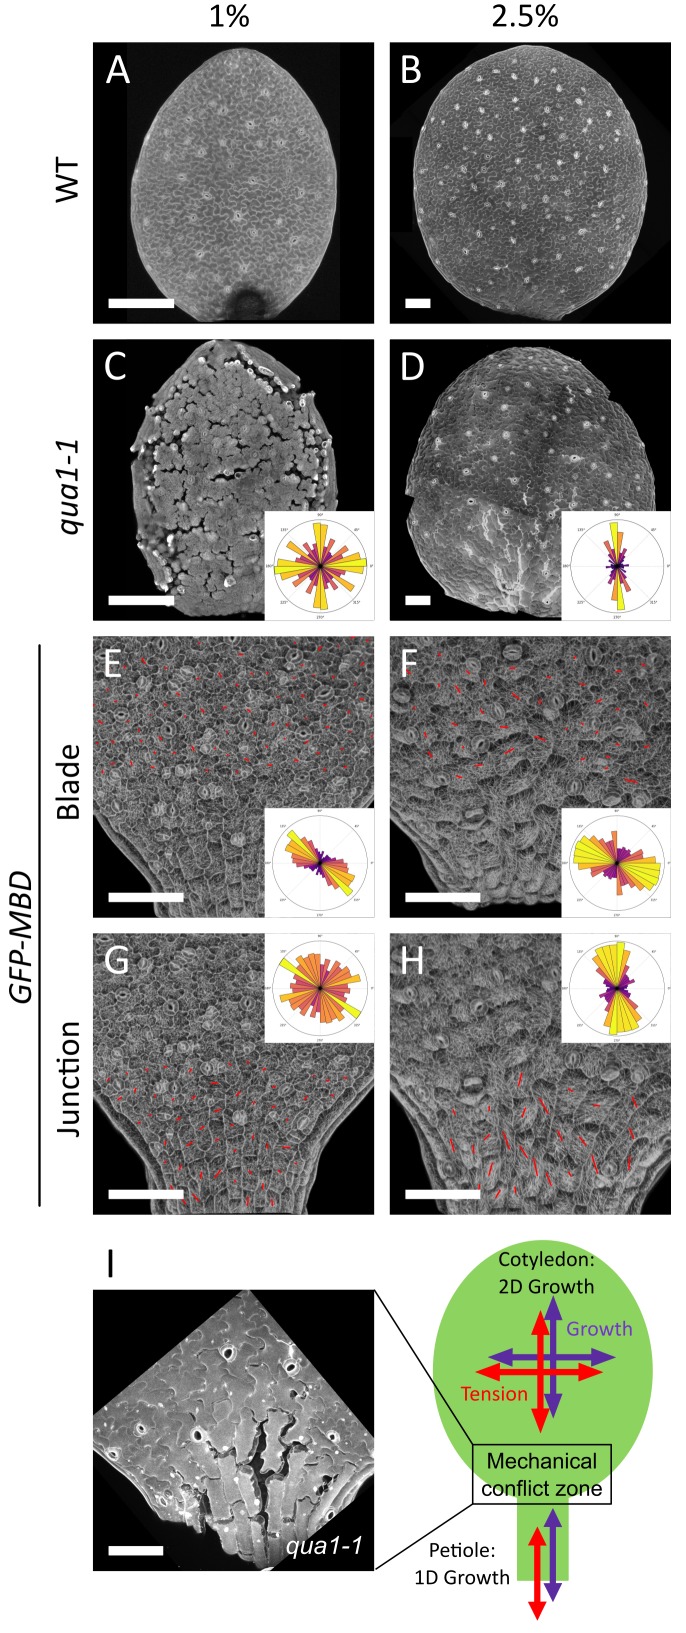
Figure 4. A mechanical conflict at the petiole-blade junction in cotyledons.
(A–D) Z-projections (maximal intensity) of confocal stacks from representative, propidium iodide stained, 3-day (A) or 5-day (B) old WT cotyledons and 3-day (C) or 5-day (D) old qua1-1 cotyledons grown on 1% (A, C) and 2.5% (B,D) agar medium. (E–H) Surface signal extracted from confocal stacks, of representative GFP-MBD cotyledons grown on 1% (E,G; n = 12 cotyledons) and 2.5% (F,H; n = 13 cotyledons) agar medium. Red lines are the output of the FibrilTool macro for the blade region (E (n = 898 cells), F (n = 639 cells)) and petiole-blade junction (G (n = 550 cells), H (n = 425 cells)). The polar histograms in C and D show the global distribution of cell separation orientation in qua1-1 cotyledons (respectively 12 and 8 samples from three biological replicates); the polar histograms in E-H show the distribution of microtubule array orientations for 12 samples. (I) Schematic representation of the effect of differential growth from the cotyledon and the petiole resulting in a mechanical conflict at the junction with higher tensile stress. The close-up image is extracted from a petiole-blade junction in the qua1-1 mutant. Scale bars, 100 µm.


