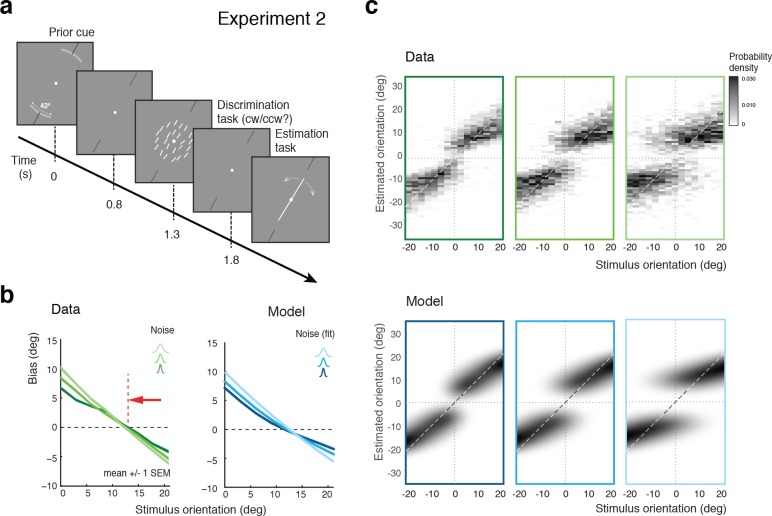
Figure 5. Effect of the stimulus prior.
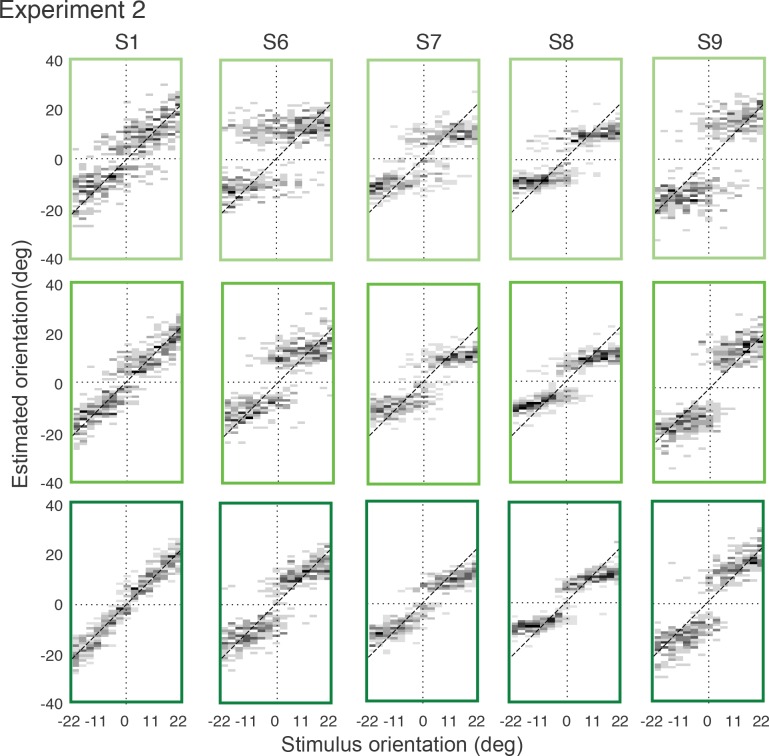
(a) Experiment 2 was identical to Experiment 1 except that at the beginning of each trial, subjects were shown the total range within which the stimulus orientation would occur in the trial (gray arc, subtending 21 degrees). (b) We hypothesize that reminding subjects of the exact stimulus range at the beginning of each trial helps them to form a more accurate (and more narrow) representation of their stimulus prior. If subjects’ orientation estimates were indeed the result of the conditioned Bayesian inference as assumed by the self-consistent observer model, then the bias curves should shift towards the discrimination boundary. The data support this prediction: Subjects’ bias curves (combined subject, see Figure 7 for individual subjects) are shifted towards the discrimination boundary compared to Exp. 1. (c) As with Exp.1, the fit self-consistent model provides an accurate description of the distribution pattern of subjects’ orientation estimates.


