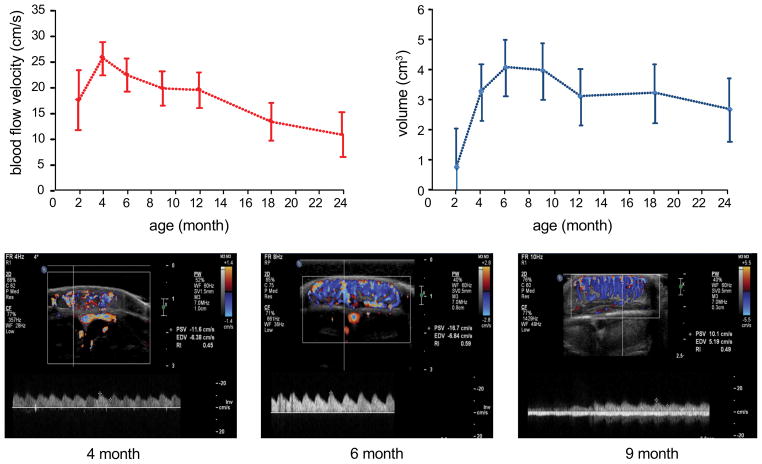
Figure 2. Ultrasound measurements track longitudinal changes in hemangioma blood flow and size.
a, Changes in mean blood flow velocity (+/− SD) for all subjects at each time point in the study indicate increasing flow velocities that peak at 4 months of age then progressively decline. b, HE size (volume) peaks at 6 months marking the end of HE proliferation, remains stable in size between 6–9 months and then begins to decrease in size. Representative color Doppler ultrasound images from single subject at (c) 4 months, (d) 6 months and (e) 9 months of age. The calculated flow velocity measurements (cm/s) are displayed on the right hand side of each image where PSV= peak systolic velocity and EDV= end diastolic velocity.

