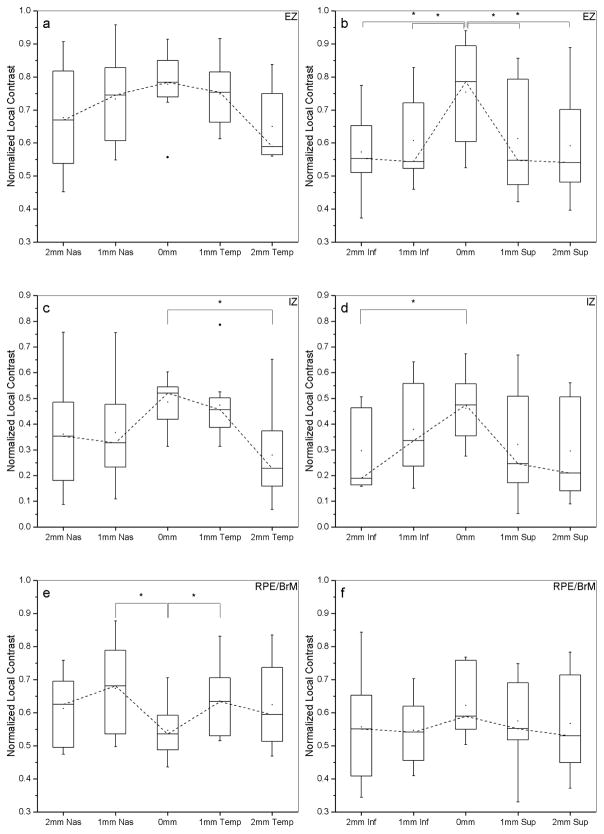
Figure 3. Comparison of normalized local contrast across eccentricities for carriers exhibiting a TLR.
Left column (panels a,c,e) plots are for horizontal and right column (panels b,d,f) are for vertical transfoveal SDOCT line scans of carriers exhibiting a TLR with available SDOCT scans. Box plots depict the interquartile range (IQR), median and whiskers extend to 1.5 × IQR. Dashed lines join the median values. Filled squares indicate mean values and filled circles indicate outliers. Outer retina layers are designated as Ellipsoid Zone (EZ), Interdigitation Zone (IZ) and Retinal Pigment Epithelium/Bruch’s Membrane (RPE/BrM), top to bottom rows. Normalized local contrast values at the foveal center (0 mm) were compared with those parafoveally at 1 mm and at 2 mm. Statistically significant differences are denoted with asterisks (paired t-tests at the 0.05 level).

