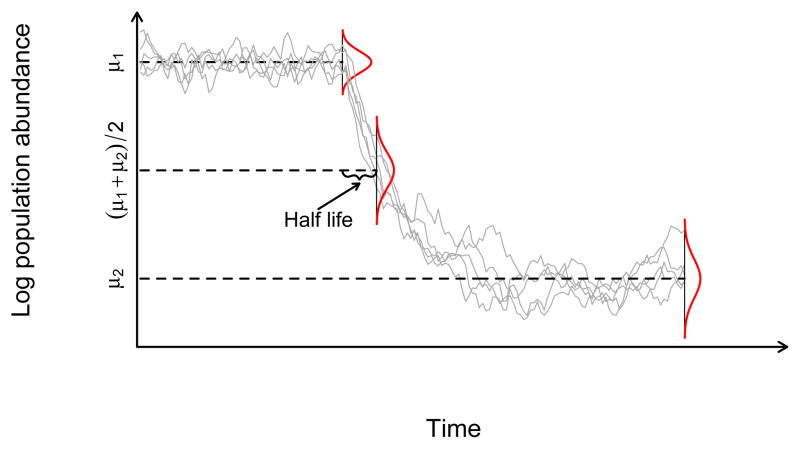
Figure 2.
The stochastic Gompertz change-point process and the half life of the change in the mean of the dynamical process, t̄ = ln(1/2)/ln c2. Plotted are 5 realizations of the Stochastic Gompertz model of population abundance under a change-point process. Dotted lines mark the process mean before the breakpoint (μ1), the mean after the breakpoint (μ2), and the arithmetic average of both means ((μ1 + μ2)/2). The time at which such arithmetic average is reached is the half life of the process, t̄. As noted in the text, c2 = e−θ2 corresponds to the post-change point strength of density dependence.

