Figure 2.
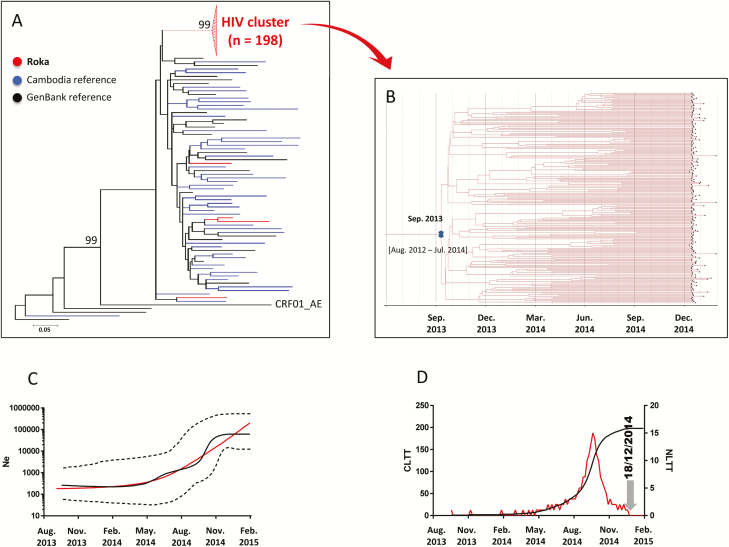
Human immunodeficiency virus type 1 (HIV-1) env C2V3 sequences. A, Maximum-likelihood phylogenetic tree for HIV-1 env C2V3 sequences from 202 case sequences (indicated in red), 45 Cambodia sequences (blue), and 24 GenBank reference sequences (black). The Roka outbreak–associated CRF01_AE HIV cluster is represented by a red triangle. Four sequences (amplified from National Center for HIV/AIDS, Dermatology and Sexually Transmitted Diseases [NCHADS] patients 171, 184, 185, and 116) from Roka did not group within the outbreak-associated cluster, and were isolated from individuals presenting nonrecent HIV-1 infections and who were negative for HCV and HBV. The unit for the scale bar of 0.05 is the number of nucleotide substitutions per site. GenBank accession numbers for the Roka HIV env C2V3 sequences were KY570019–KY570220. Accession numbers for other Cambodia sequences were KY570221–KY570265. B, Bayesian time-scaled phylogenetic tree of 198 HIV-1 env C2V3 sequences from the Roka HIV cluster. The branch lengths represent the number of substitutions per site per year. The cross marks the mean estimate of the time to the most recent common ancestor with 95% highest posterior densities (HPDs). C, Effective viral population size over time. The Bayesian skyline plot shows the median viral population size over time (black solid line) and 95% HPDs around the estimate (black dashed lines). Expansion model is indicated by a red line. D, Lineage-through-time plot. CLTT indicates the cumulative lineage through time (black solid line); NLTT indicates the noncumulative lineage through time (red solid line). Abbreviations: HBV, hepatitis B virus; HCV, hepatitis C virus; Ne, effective population size.

