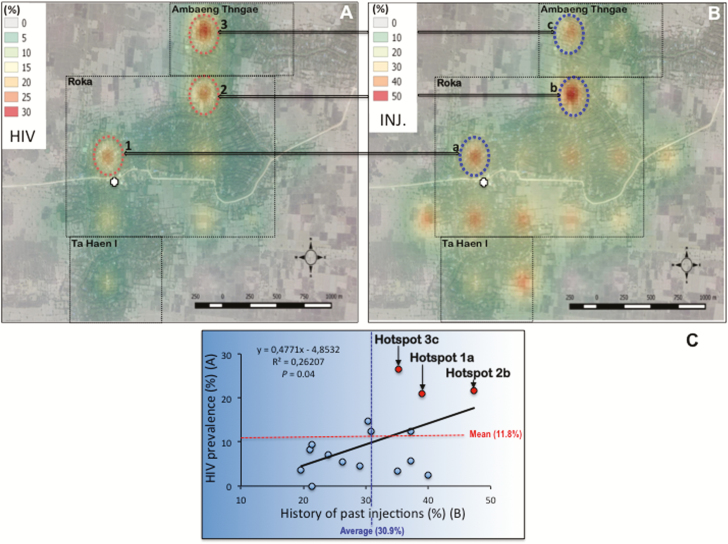
Figure 3.
Geographic variations in interpolated human immunodeficiency virus (HIV) prevalence (A), frequency of history of injections (INJ.) with the unlicensed practitioner (B) across the surveillance area, and correlation (C). Roka, Ambang Thngae, and Ta Haen I villages are delineated by a dotted rectangle. The practitioner’s house is depicted by a white cross. Each hotspot is indicated by a circle, associated with a number (1, 2, or 3 for HIV) or a letter (a, b, or c regarding history of past injections).

