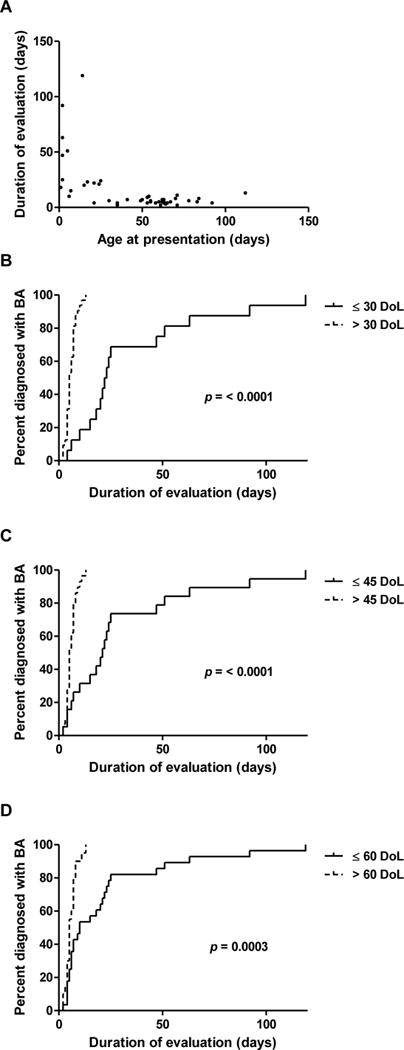
Figure 2. Evaluation times vary inversely with age at referral.

(A) Scatter plot of P2 times and age at presentation demonstrating an inverse relationship. (B-D) Kaplan-Meier curves for time to KP after specialist referral, based on age at presentation. Differences between groups were calculated using the log-rank test.
