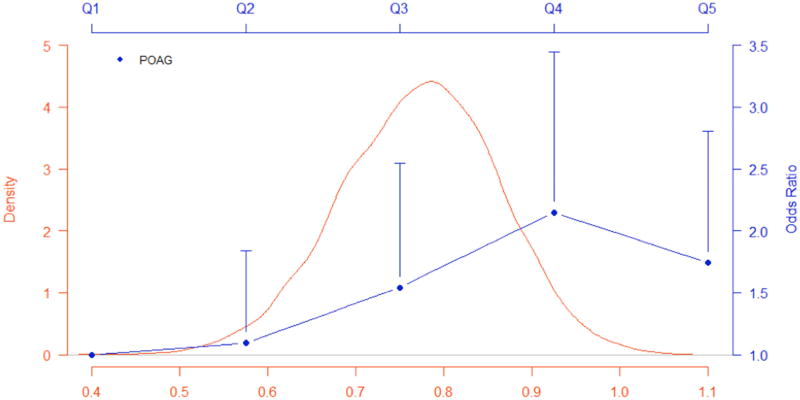
Figure 1. Distribution of weighted genetic risk score from previously reported SNPs and association with primary open angle glaucoma.
Distribution of the weighted GRS and odds ratios of POAG comparing each of the four upper GRS quintiles to the lowest quintile, adjusting for age, gender, CCT, IOP, and SBP. Vertical lines of each point (OR) represents the upper 95% confidence interval.

