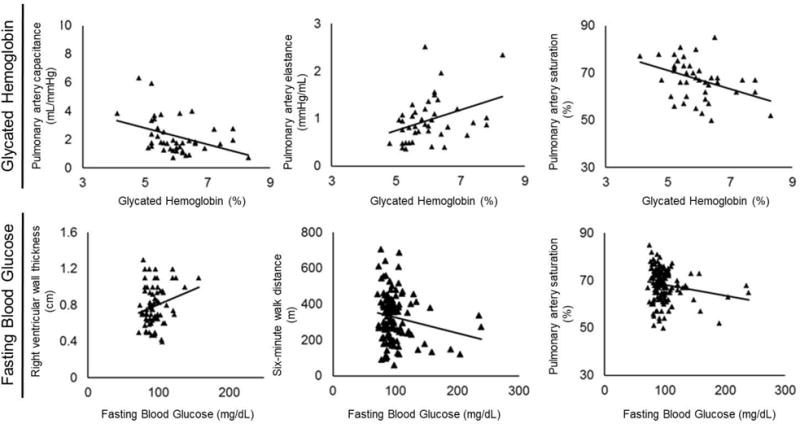
Figure 1. Correlation plots between indices of hyperglycemia and measures of pulmonary arterial hypertension severity.

The figures below depict the significant associations between glycated hemoglobin levels and pulmonary arterial capacitance, pulmonary arterial elastance, as well as pulmonary artery saturation in the pulmonary arterial hypertension cohort. Similarly, significant but weaker associations are evident between fasting blood glucose levels and pulmonary artery saturation and six-minute walk distance including trends toward associations with right ventricular wall thickness.
