
Figure 5. SARM1 loss and WldS function in the same axon degeneration pathway.
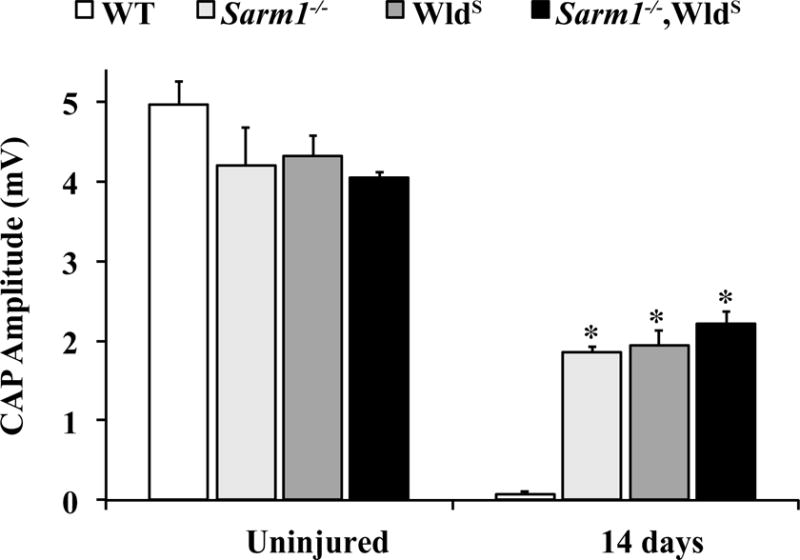
To determine if SARM1 and WLDS function in the same axon degeneration pathway, mice expressing WldS in a Sarm1-null background were generated. Axon degeneration was assessed by quantifying the maximal amplitude of the CAP 14 days after ONC. The data for Sarm1−/− and WldS mice are the same as from Figure 1. The CAP amplitude of all genotypes was significantly reduced 14 days after ONC, however, and Sarm1−/−, WldS, and Sarm1−/−;WldS mice all had significantly higher CAPs compared to WT controls. There was no difference in CAPs from Sarm1−/−;WldS mice compared to WldS or Sarm1−/− mice (n ≥ 5 for each genotype and condition).