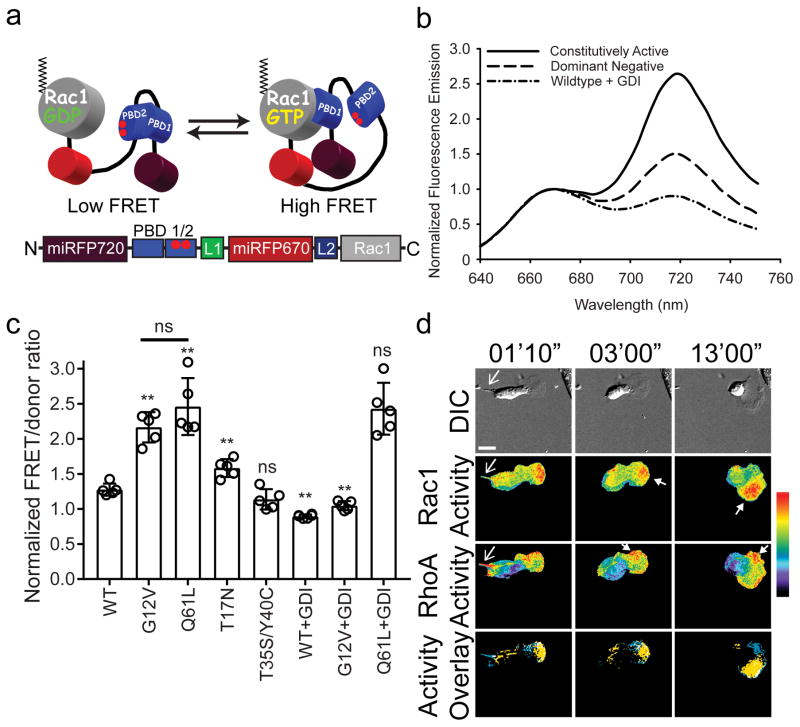
Figure 2. NIR-Rac1 biosensor for live cell imaging.
(a) Schematic of the single-chain NIR-Rac1 biosensor design. From N- to C-terminus: Dark red: miRFP720; PBD1: p21 binding domain 1; PBD2: p21 binding domain containing H83D-H86D GTPase binding deficient mutations; Red: miRFP670; full length Rac1. This orientation enables posttranslational isoprenylation of the C-terminus, thus maintaining the native interaction with appropriate membrane domains and the guanine nucleotide dissociation inhibitor (GDI). GTP versus GDP-loading of Rac1 changes the intramolecular conformation and affects FRET. (b) Representative normalized fluorescence emission spectra of constitutively activated, dominant negative, and wildtype NIR-Rac1 biosensors expressed with excess GDI. Spectra are measured by exciting the NIR-Rac1 sensor mutants expressed in cell suspensions at 600 nm wavelength, and are from the data analyzed and presented in (c), from 5 independent experiments. (c) Wildtype (WT) or mutant versions of NIR-Rac1 biosensor with or without 4× excess GDI. N=5 independent experiments shown with mean ±SEM. Student t-tests are two-tailed. ** WT vs G12V, p=2.626562×10⁻⁵; WT vs Q61L, p=2.158669×10⁻⁴; WT vs T17N, p=2.122228×10⁻³; WT vs T35S/Y40C, “ns”=not significant, p=0.1003134; G12V vs Q61L, p=0.1877456; WT vs WT+GDI, p=2.627320×10⁻⁶; G12V vs G12V+GDI, p=3.684825×10⁻⁶; and Q61L vs Q61L+GDI, p=0.9049651. (d) Representative timelapse panels of imaging RhoA and Rac1 in a single living MEF (additional time points are shown in Supplementary Fig. 11) from 16 cells from 6 independent experiments. 628/32 and 436/20 excitation filters were used for NIR and mCerulean-mVenus FRET excitation, respectively. 480/40 and 535/30 filter pair was used for mCerulean-mVenus FRET signal, whereas 684/24 and 794/160 filter pair was used for miRFP670-miRFP720 FRET signal. Top panels: Differential interference contrast. Middle two panels: Rac1 activity (upper) and RhoA activity (lower). Bottom panels: Localizations of high Rac1 (yellow) and high RhoA (blue) activities are overlaid, where regions of colocalization are shown in white. Regions of high Rac1 and RhoA activities were defined by intensity thresholding the top 2.5 % of pixel ratio values within the image intensity histogram. Regions and features of interest are indicated using matching colored arrowheads. White bar=20μm. Pseudocolor bar corresponds to ratio limits of 1.0 to 1.55 for Rac1 and 1.0 to 1.32 for RhoA activities (black to red).

