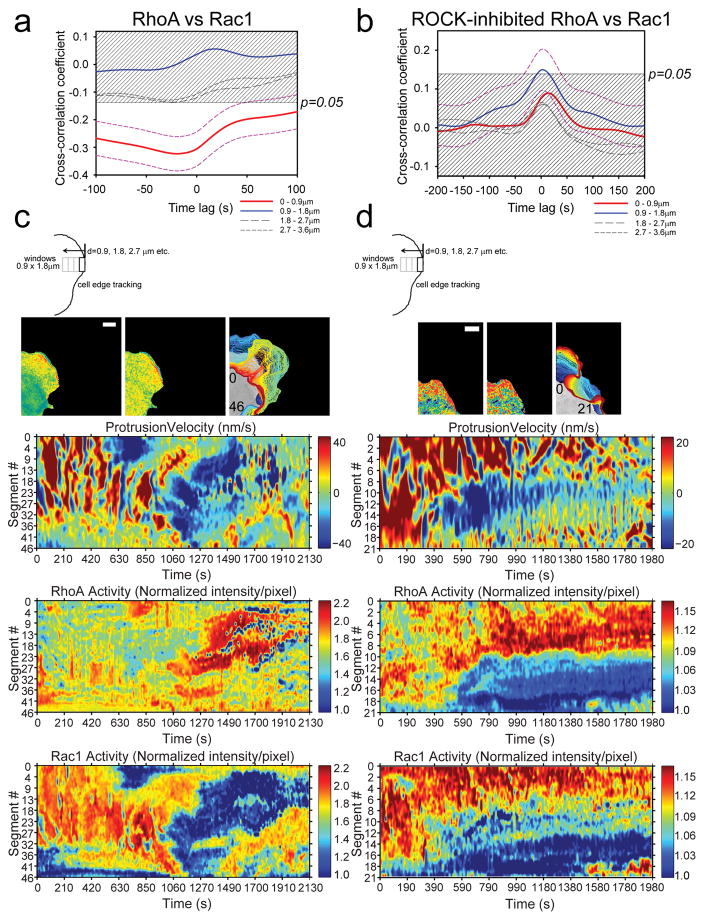
Figure 3. Morphodynamic analysis of RhoA-Rac1 antagonism.
(a) Cross-correlation coefficient as a function of timelags between RhoA and Rac1 activities in protruding edge of MEFs. Dashed magenta lines indicate 95% confidence interval (CI) for the cross-correlation function from the edge region (Red line: 0–0.9μm). The time difference between RhoA versus Rac1 biosensor response was −19.6s ±31.6s (±95% CI); i.e., RhoA activity onset precedes Rac1 activity onset by approximately 19.6s. 95% CI are omitted from the rest of plots for clarity. The shaded region indicates p>0.05. n=1250 individual sampling window segments were measured from 16 cells, from 6 independent experiments. (b) Example edge tracking evolution (top panels) from a single cell and associated morphodynamic maps of the velocity, RhoA and Rac1 activities (lower three panels). The edge velocity, RhoA activity, and Rac1 activity measured within window segments at the leading edge of a single representative cell are compiled on the Y-axes and followed in time on the X-axis. White bar=10μm. Example set taken from total of 16 cells, from 6 independent experiments. (c) Cross-correlation coefficient as a function of timelags between RhoA and Rac1 activities in protruding edge of MEFs with ROCK inhibitor Y-27632 treatment. Dashed magenta lines indicate 95% CI for the cross-correlation function from the region adjacent to the cell edge (Blue line: 0.9–1.8μm). 95% CI are omitted from the rest of plots for clarity. The shaded region indicates p>0.05. n=990 individual sampling window segments were measured from 18 cells, from 3 independent experiments. (d) Example edge tracking evolution (top panels) from a single cell and associated morphodynamic maps of the velocity, RhoA and Rac1 activities (lower three panels). White bar=10μm. Example set taken from 18 cells, from 3 independent experiments. The number inserts in the edge evolution panels in (b) and (d) indicate the orientation of the measurement window segments that correspond to the Y-axes of the morphodynamic maps as shown.

