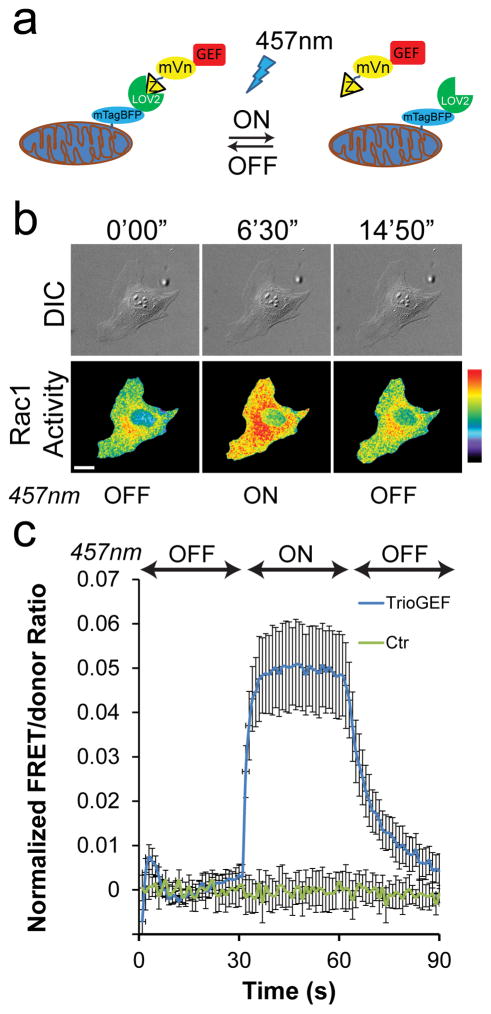
Figure 5. Concurrent measurement of Rac1 activity during LOV-TRAP optogenetics.
(a) Schematic drawing of the LOV-TRAP system. Mitochondrially targeted mtagBFP-LOV2wt sequesters the GEF-domain of interest attached to Zdk1 molecule. Upon photoactivation with 457nm light, Zdk1-GEF is released and act on the target GTPase, followed by dark relaxation upon cessation of illumination. (b) An example panel of a MEF undergoing photoactivation of LOV-TRAP and concurrent measurements of Rac1 activity using the NIR-Rac1 biosensor. NIR-Rac1 biosensor image sets were acquired every 10s. 457nm illumination (cycles of 4s-on, 6s-off) was started at 300 s and ended at 600 s time points (additional time points are shown in Supplementary Fig. 15a). White bar=20 μm. Pseudocolor limits are 1.0 to 1.74 (black to red). Example taken from N=17 independent photoactivation experiments. (c) Quantification of Rac1 activity measured concurrently with the LOV-TRAP-TrioGEF photoactivation. During the “on” phase of the 457nm illumination, Rac1 activity levels are significantly elevated compared to the control which received no 457nm illumination. The Student t-test (two-tailed) was used to compare Rac1 activity during photoactivation (300s–600s) and dark relaxation (600s–900s) versus the activity prior to photoactivation (0s–300s), and shown in Supplementary Table 2. N=17 independent photoactivation experiments for LOV-TRAP-TrioGEF, n=10 independent mock-photoactivation experiments for the control condition, all shown with mean ±SEM.

