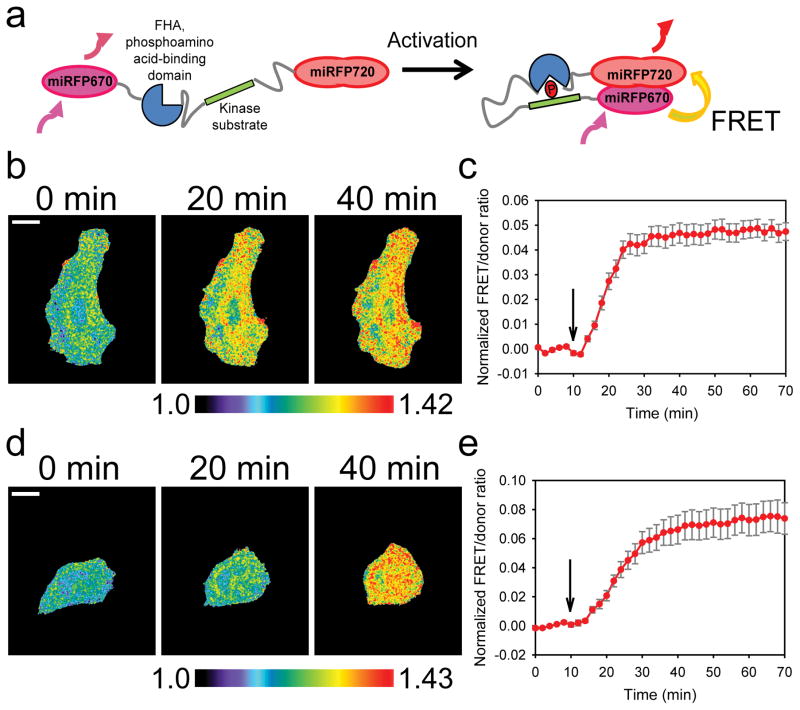
Figure 6. NIR-FRET pair of fluorescent proteins in kinase-substrate biosensors.
(a) The basic design principle for the PKA31 and JNK32 sensors, modified from the original cyan-yellow fluorescent protein versions 33 to using the NIR miRFP670 10 and miRFP720 fluorescent proteins. (b) Representative timelapse images of a HeLa cell expressing the NIR-AKAR PKA sensor and undergoing stimulation (additional time points are shown in Supplementary Fig. 16a), from n=3 independent stimulation experiments. 1mM dbcAMP was added at the 10min time point and the FRET/donor ratio was monitored for up to 70min; FRET/donor ratio from NIR-AKR is shown with mean ±SEM (c). White bar, 20μm. Black arrow indicates the time point at which the stimulation was performed. n=3 stimulation experiments. Student t-test was used (two tailed) to determine p-values between FRET/donor ratio before (0–8min) and after stimulation (10–70min), shown in Supplementary Table 3. (d) Representative time-lapse images of a HeLa cell expressing the NIR-JNKAR JNK sensor and undergoing stimulation(additional time points are shown in Supplementary Fig. 16b), from n=3 independent stimulation experiments. 1μg/mL anisomycin was added at the 10 min time point and the FRET/donor ratio was monitored for up to 70 min; FRET/donor ratio from NIR-JNKR is shown with mean ±SEM (e). White bar, 20 μm. Black arrow indicates the time point at which the stimulation was performed. N=3 independent stimulation experiments. Student t-test was used (two tailed) to determine p-values between FRET/donor ratio before (0–8min) and after stimulation (10–70min), shown in Supplementary Table 3.

