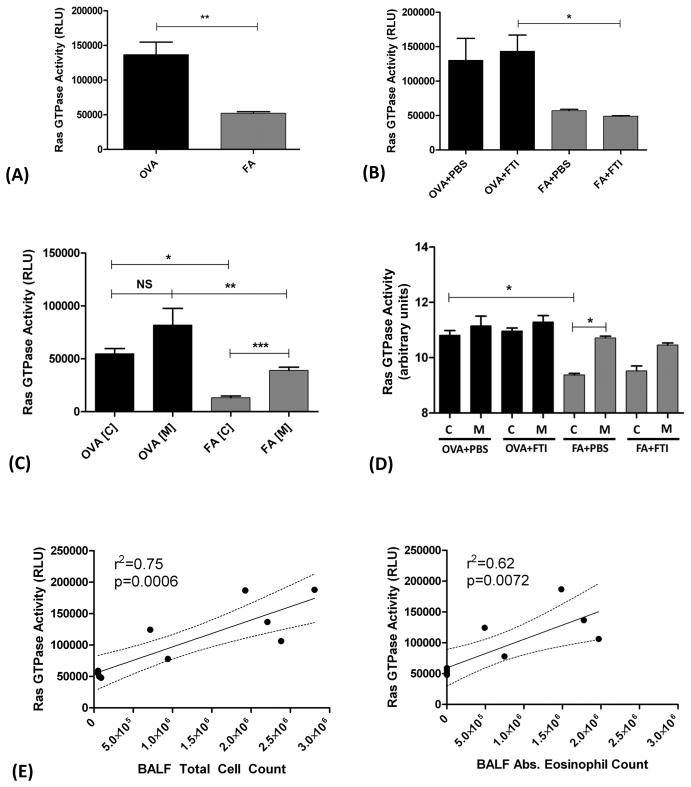
Figure 3. Effect of FTI-277 Treatment on Ras GTPase Activity in Mouse Lung.
BALB/c mice were sensitized to ovalbumin (OVA) and then challenged with 1% OVA aerosol or filtered air six times over a 2-week period. Mice were injected daily with FTI-277 (20 mg/kg/day, i.p.) before each OVA aerosol exposure. Ras GTPase activity was measured in whole lung homogenates, and in cytosolic [C] and membrane [M] subcellular fractions. Ras GTPase enzymatic activity was measured by ELISA.
(A) In unfractionated whole lung homogenate tissue, OVA-exposed mice have 2.61-fold greater total Ras GTPase activity compared to FA controls (**p=0.0022 by t test).
(B) FTI-277 treatment had no effect on Ras GTPase activity in either FA or OVA-exposed mice (p=NS by 1-way ANOVA). The OVA groups have greater Ras activity than the FA control groups (2.28-fold difference in OVA+PBS vs. FA+PBS, p=NS; and 2.92-fold difference in OVA+FTI vs. FA+FTI *p<0.05 by 1-way ANOVA).
(C) Comparing groups by subcellular fraction, Ras GTPase activity is higher in the cell [M] fractions as compared to [C] fractions for both the OVA and FA groups (OVA[C] vs. OVA[M], p=NS; FA[C] vs. FA[M], ***p<0.001, by 1-way ANOVA). In both the [C] and [M] fractions comparing OVA vs. FA, Ras GTPase activity was significantly greater in the OVA groups (OVA[C] vs. FA[C], *p<0.05; OVA[M] vs. FA[M], **p<0.01 by 1-way ANOVA).
(D) In OVA-exposed mice, treatment with FTI-277 did not affect Ras enzyme activity in the membrane [M] or cytosolic [C] fractions for both groups (OVA+PBS [C] vs. [M] and OVA+FTI [C] vs. [M], p=NS for all comparisons by 1-way ANOVA). Ras GTPase activity in the [C] fraction of the OVA+PBS group was significantly higher than the FA+PBS control (OVA+PBS [C] vs. FA+PBS [C], *p<0.01 by 1-way ANOVA). The [M] fraction had a significantly greater Ras GTPase activity as compared to the [C] fraction in the FA+PBS group (FA+PBS [C] vs. FA+PBS [M], *p<0.05 by 1-way ANOVA), but this effect was only a trend in the FTI-277-treated FA mice (FA+FTI [C] vs. FA+FTI [M], p=NS by 1-way ANOVA). Note: Ras GTPase activity units were natural log transformed prior to analysis. The graph shows transformed data and therefore displays arbitrary units.
(E) Ras GTPase activity demonstrated a positive linear correlation with BALF total inflammatory cell count (r2=0.75, p=0.0006, confidence interval (CI) 0.0239 to 0.0615) and with BALF absolute (abs.) eosinophil count (r2=0.62, p=0.0072, CI 0.0165 to 0.076). Note: Total Ras activity of combined membrane (M) and cytosol (C) fractions are plotted.

