
Figure 1. CSE-exposure induces cytokine/chemokine production and Caspase-1 activity in A549 and THP-1 cells.
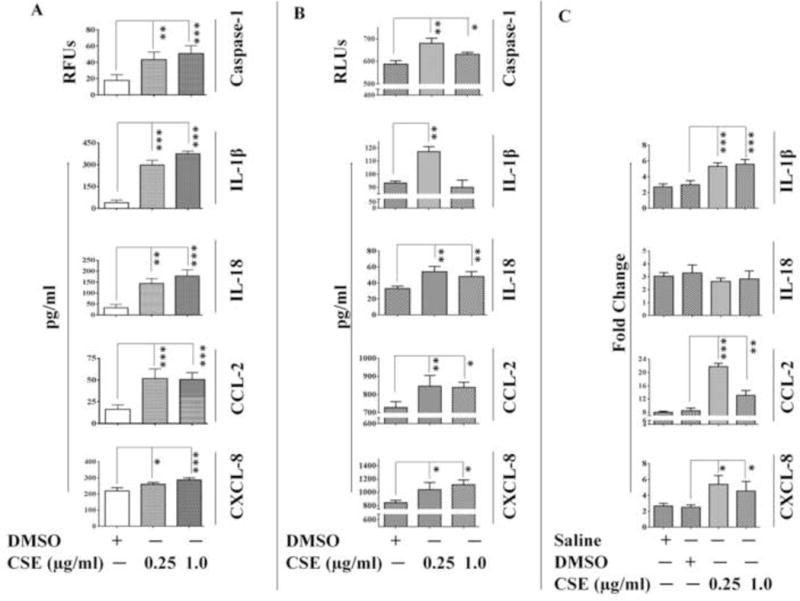
Caspase-1 activity and cytokine/chemokine levels in (A) THP-1 cells and (B) A549 cells as determined by ELISA; and (C) mRNA level expression of cytokine/chemokines in A549 cells following 6-hr CSE-challenge.(n=3-4/group). Results are a representation of three independent experiments. Error bars represent SEM, * (p<0.05), ** (p<=0.01) and *** (p<=0.001), as per one-way ANOVA for multiple comparisons.