
Figure 2. CSE-challenge promotes the expression of lipid raft proteins and membrane localization of NLRP10/12 in A549 cells.
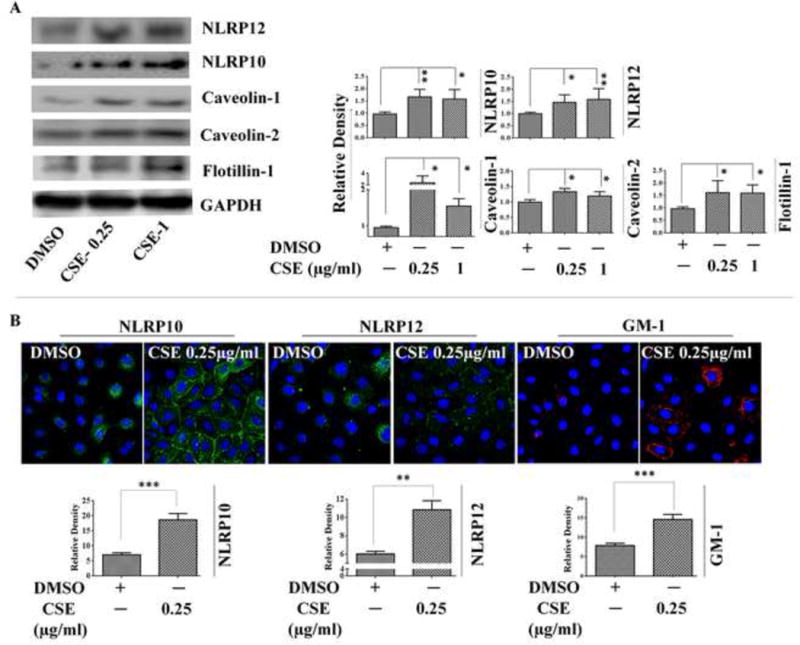
(A) Western Blot images and Densitometry results for the expression of NLRP10/12 and lipid raft proteins (Caveolin-1, Caveolin-2 and Flotillin-1) following 6-hr CSE-challenge in A549 cells; and (B) Immunofluorescence results demonstrating cellular localization of NLRP10, NLRP12; and GM-1 (lipid raft marker) following 6-hr CSE-challenge in A549 cells. (n=3-4/group). Results are a representation of 4 independent experiments. Error bars represent SEM, * (p<0.05) and ** (p<=0.01), as per oneway ANOVA for multiple comparisons. Here, CSE-0.25: CSE (0.25 μg/ml) and CSE-1: CSE (1 μg/ml)