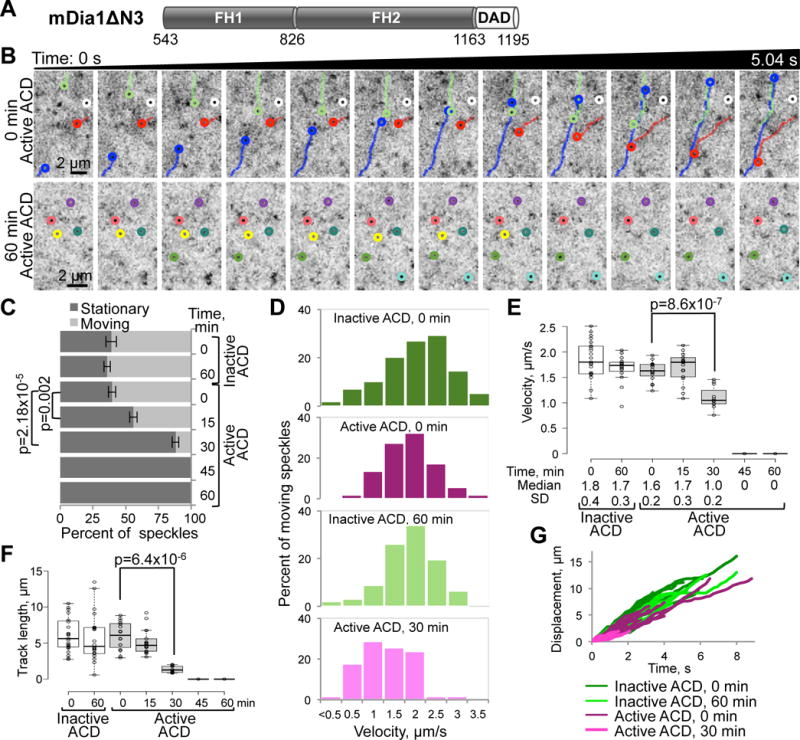
Figure 3. Inhibition of the directional movement of mDia1 by ACD in living cells.

(A) Domain organization of mDia1ΔN3 (a.a. 543-1192 of murine mDia1): FH1 and FH2, formin-homology domains 1 and 2; DAD, diaphanous autoregulatory domain.
(B) Representative tracks of EGFP-mDia1ΔN3 speckles in XTC cells treated with active ACD are shown on series of 12 consecutive images taken with 0.42s intervals at the beginning of the experiment (0 min time point; upper panels) and after 1 h of active ACD treatment (lower panels), where virtually all speckles have stopped.
(C–G) Individual EGFP-mDia1ΔN3 speckles from the time-lapse images were analyzed for indicated ACD-treatment periods. (C) Fractions of stationary and moving EGFP-mDia1ΔN3 speckles for each indicated ACD-treatment condition were calculated from three sets of 10–15 consecutive images (~2-s duration each) taken at the beginning, middle, and end of each 45-s movie (Movie S5) and presented as mean values ± SD. (D) Velocity distributions of moving speckles calculated based on 100–300 displacement events. (E) A box plot of velocities calculated from 10–20 individual speckle tracks; median velocities and SD are indicated. (F) A box plot of distances traveled by each speckle in a track. (G) Individual tracks (displacement versus time) of moving speckles; note significantly shorter tracks for EGFP-mDia1ΔN3 speckles after 30-min ACD treatment. Stationary speckles are not presented in (D) and (G). See also Movie S5.
