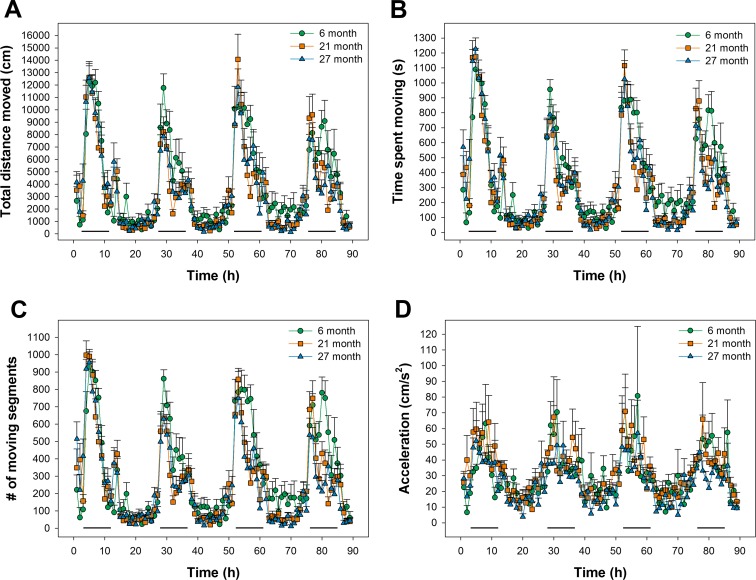
Fig. 2.
Data derived from tracking animal movements during the 90 h experimental period. Analyses included a total distance moved, b time spent moving, c number of moving segments, and d acceleration. Data are averaged over hourly intervals during both the light and dark phases of the L:D cycle. Dark horizontal lines represent the dark phase of the cycle. Data represent mean + SEM calculated for hourly intervals

