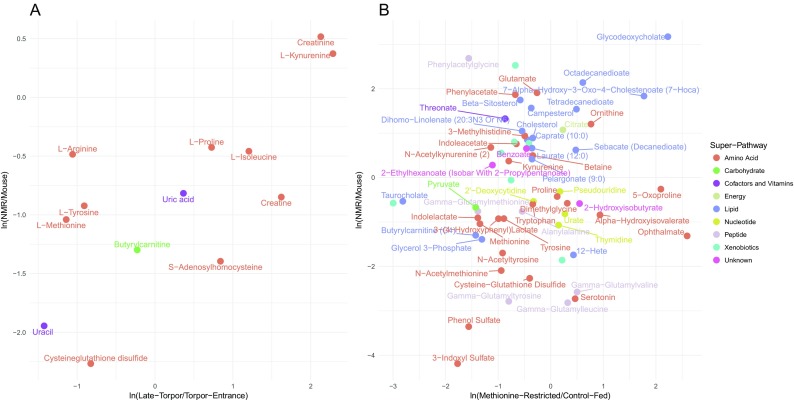
Fig. 4.

Association between metabolite fold changes in naked mole-rats relative to mice and other compared studies. Mean ln(fold change) of metabolite abundances in naked mole-rats (NMR) versus mice versus: a late torpor versus torpor entrance in 13-lined ground squirrel and b methionine-restricted versus control-fed rats. Metabolites selected for these analyses are described in the “Methods” section. Metabolites are color-coded according to the super-pathway they are assigned to by Metabolon, Inc.
