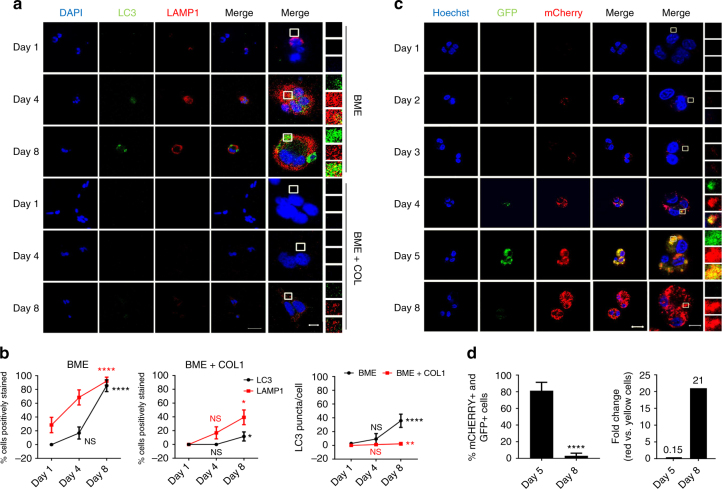
Fig. 1.
D2.0 R cells activate autophagy upon entering a dormant state. Representative images are shown for a Immunofluorescent staining of lysosomal (LAMP1, red) and autophagic (LC3, green) markers of D2.0 R cells in BME (upper panels) and BME + COL1 (lower panels) with b Quantification of the percentage of cells exhibiting LC3 positive puncta and LAMP1 staining out of the total number of cells analysed (mean ± s.e.m, n = 30–42 cells. Comparisons are relative to Day 1 by Kruskal–Wallis, Dunn’s post test. *P ≤ 0.05; ****P ≤ 0.0001) and the average number of LC3 puncta per cell (Comparisons by Kruskal–Wallis, Dunn’s post test. **P ≤ 0.01 and ****P ≤ 0.0001). c D2.0 R cells transfected with the mCherry-GFP-LC3 reporter show activation and completion of the autophagic cycle (red fluorescence only) when plated in BME matrices for 8 days. d The graphs represent the percentage of cells with double-positive puncta (mCherry+ and GFP+) (autophagosomes) out of the total number of cells analysed (left graph) (mean ± s.e.m, n = 35–39 cells). Comparisons by Kruskal–Wallis, Dunn’s post test. ****P ≤ 0.0001) and the rate of conversion from cells exhibiting yellow puncta to red-only puncta expressed as fold change (right graph). Scale bars are 50 and 10 μm for a and 20 and 10 μm for b

