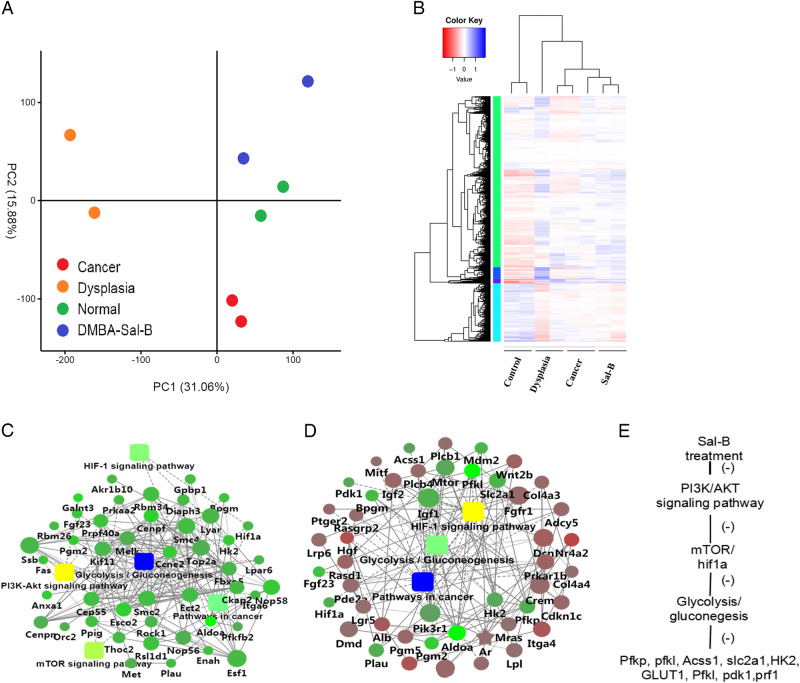
Fig. 1. Transcriptional landscape for DMBA-induced model and Sal-B-DMBA-treated animal model.
a PCA of the entire set of expressed genes. b Heatmap of gene expression data are shown for all samples (columns) color-coded (bottom of heatmap) the same as the PCA plot. Data were log2 transformed and then normalized before generating heatmap for direct comparison of data. DEGs (red or blue are downregulated or upregulated, respectively) for each animal were mapped by lane for each of two samples from the normal control group, DMBA-induced model group and Sal-B–DMBA group. c, d Gene interaction network of downregulated genes in Sal-B–DMBA-treated group versus DMBA-induced dysplasia (c) or cancer group (d). The networks were clustered into modules and pathways enriched in the modules are indicated. Circle nodes for genes/proteins; rectangle for KEGG pathway or biological process. Pathway were colored with gradient color from yellow to blue, yellow for smaller P-value, blue for bigger P-value. Biological processes were colored with red. In case of fold-change analysis, genes/proteins were colored in red (upregulation) and green (downregulation). e The predicted molecular action of Sal-B. DEGs, differentially expressed genes; PCA, principal component analysis

