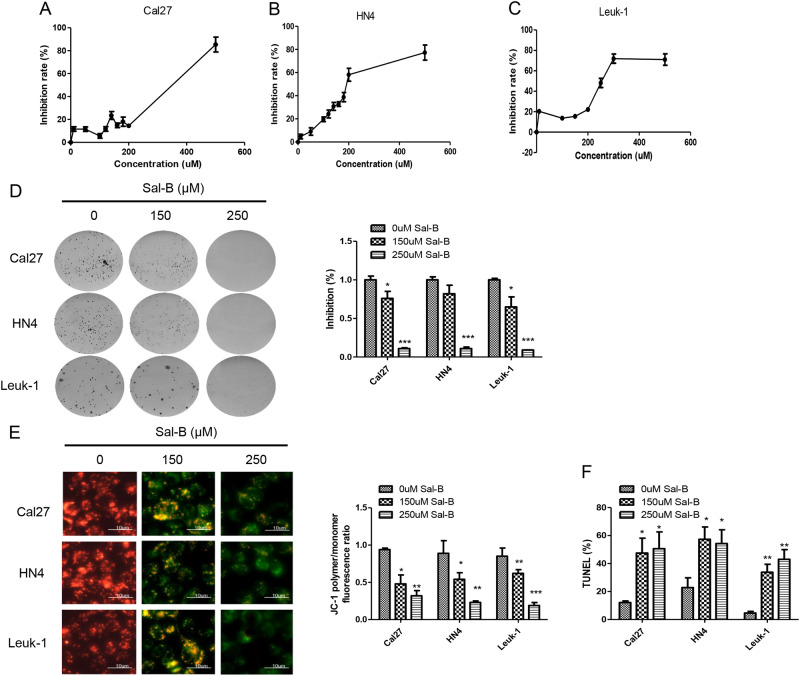
Fig. 6. Sal-B inhibited proliferation and colonigenic ability and induced cell apoptosis.
a Cal27, b HN4, and c Leuk1 cells were treated with Sal-B at different concentrations for 48 h and subsequently evaluated by the MTT assays. IC 50 values were 297 μM in Cal27, 201 μM in HN4, and 294 μM Leuk1, respectively. d Anchorage-independent growth via colony formation assay. Cal27, HN4, and Leuk1 cells were treated with 150 μm and 250 μM for 24 h, and subsequently evaluated by clony formation assay. e Quantitive analysis from (d). e MMP was measured by JC-1 staining in Cal27, HN4, and Leuk1 cells treated with 0, 150, and 250 μM of Sal-B. The fluorescence ratios of JC-1 ploymer to monomer were further quantified. Bar stands for 10 μm. f Apoptotic cell death of cells with treatment of 0, 150, and 250 μM of Sal-B measured by TUNEL assay. P < 0.05 was considered statistically significant, ns, P > 0.05, *P < 0.05, ** P < 0.01, *** P < 0.001 vs. control group

