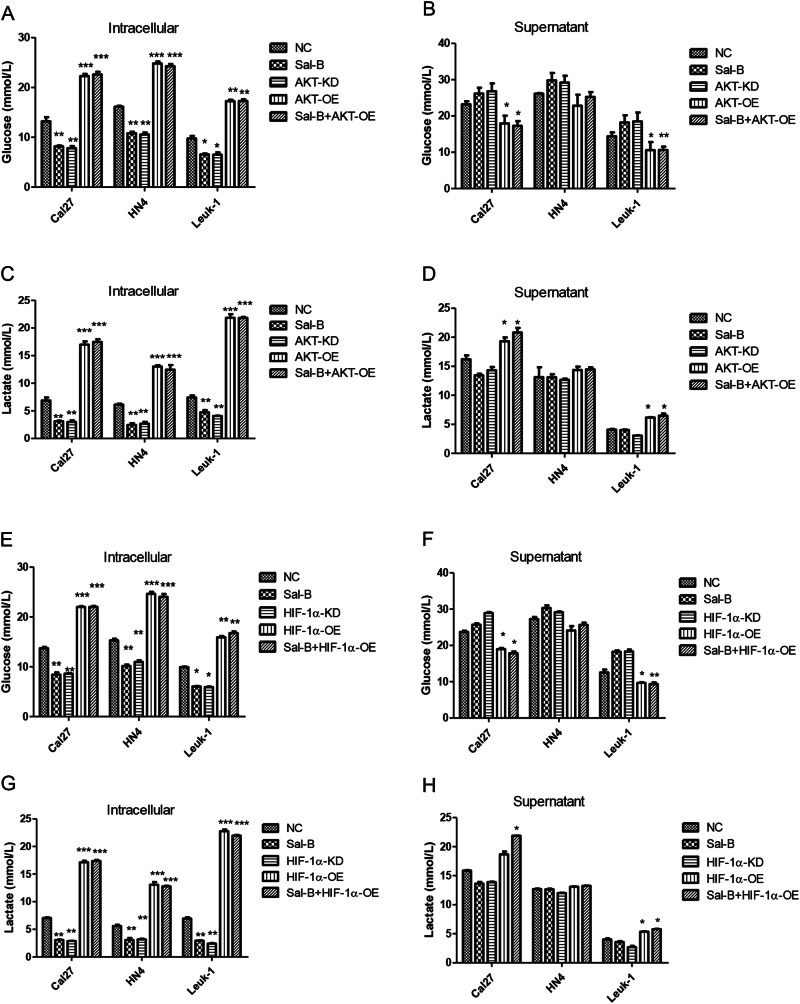
Fig. 8. Sal-B modulates glucose metabolism via the activation of PI3K/Akt signaling pathway.
Cal27, HN4, and Leuk1 cells were treated with varying conditions, including (1) without treatment (NC), (2) 250 μM of Sal-B, (3) knockdown of AKT expression using AKT shRNA lentivirus (AKT-KD), (4) overexpression of AKT using transfection of AKT lentivirus (AKT-OE), and (5) the combined treatment of Sal-B and AKT-OE. a Measurement of intracellular glucose in cells treated in varying conditions described above. b Measurement of glucose uptake in supernatants in cells treated in varying conditions described above. c Measurement of intracellular lactate production in cells treated in varying conditions described above. d Measurement of lactate production in supernatants from cells treated in varying conditions described above. Sal-B inhibit activation of HIF-1α signaling pathway to further modulate the glucose metabolism, elevated the loss of MMP and induces apoptosis. Cal27, HN4 and Leuk1 cells were treated with varying conditions, respectively, including (1) without treatment (NC), (2) 250 μM of Sal-B, (3) knockdown of HIF-1α expression using Hif-1α shRNA lentivirus (HIF-1α-KD), (4) overexpression of HIF-1α using transfection of Hif-1α lentivirus (HIF-1α-OE), and (5) the combined treatment of Sal-B and HIF-1α. e Measurement of intracellular glucose in cells treated in varying conditions described above. f Measurement of glucose uptake in supernatants in cells treated in varying conditions described above. g Measurement of intracellular lactate production in cells treated in varying conditions described above. h Measurement of lactate production in supernatants from cells treated in varying conditions described above. P < 0.05 was considered statistically significant, ns, P > 0.05, *P < 0.05, **P < 0.01, ***P < 0.001 vs. control group

