Figure 3.
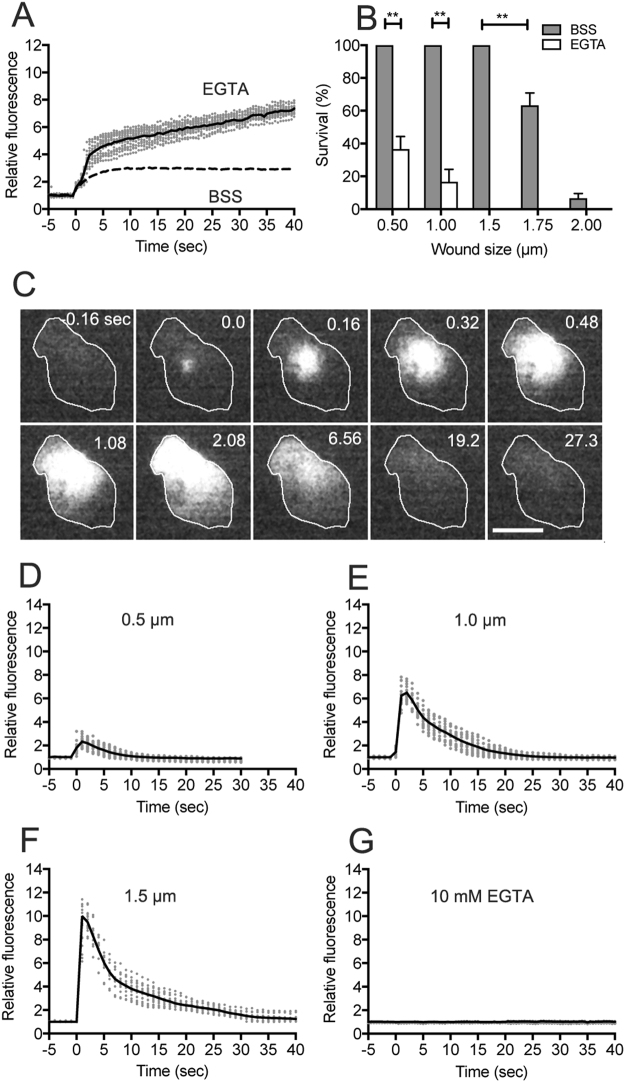
Ca2+ influx from the wound pore. (A) Time courses of PI influx in the presence (BSS) and absence (10 mM EGTA) of Ca2+ (1.0 µm wound). The solid line is an averaged line of 19 experiments in EGTA (gray dots) and the dashed line is an averaged line in BSS (from Fig. 2C). (B) Survival rate of different wound sizes in the presence (BSS) and absence (EGTA) of Ca2+. The number of cells that ruptured within 5 min after wounding was counted. Data are presented as mean ± SD (n = 20, 3 experiments, each). **P ≤ 0.0001. (C) A typical sequence of fluorescence images when a cell expressing Dd-GCaMP6s was wounded by laserporation. Note that the fluorescence began to increase at the wound site and spread over the cytoplasm. (D–F) Time courses of the fluorescence of Dd-GCaMP6s with different wound sizes (0.5, 1.0, and 1.5 µm). Each solid line shows an averaged line of 17 experiments (gray dots). (G) In the presence of 10 mM EGTA, the fluorescence of Dd-GCaMP6s did not increase after wounding (n = 20). Bar, 10 µm.

