Figure 5.

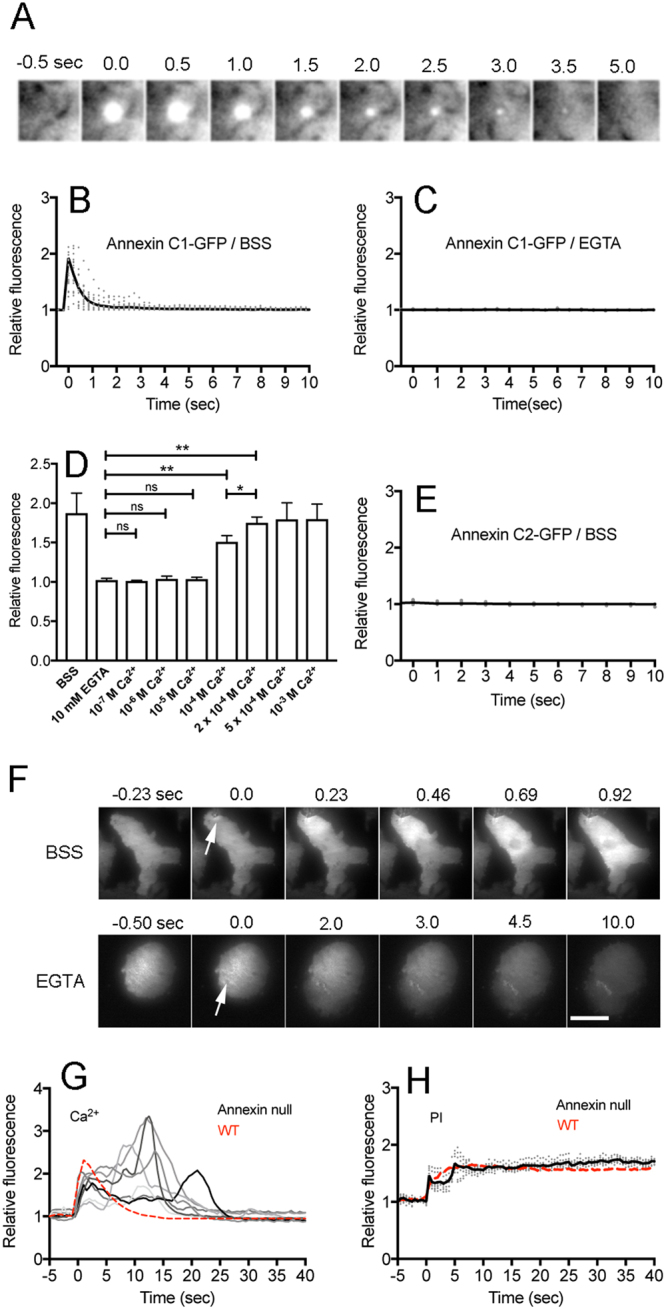
Annexin C1 accumulates at the wound site in a Ca2+-dependent manner. (A) A typical sequence of fluorescence images when cells expressing annexin C1-GFP were wounded by laserporation. Only a small area including the wound site is shown. (B and C) Time courses of fluorescence of annexin C1-GFP (B) in BSS and (C) in the presence of EGTA (0.5 µm wound, n = 15, each). (D) A dependency of the annexin C1-GFP accumulation on the free Ca2+ concentration in the external medium (0.5 µm wound). The peak intensities of annexin C1-GFP accumulation were plotted versus each Ca2+ concentration. Data are presented as mean ± SD (n = 15, each). *P ≤ 0.001; **P ≤ 0.0001; ns, not significant, P > 0.05. (E) Cells expressing annexin C2-GFP were wounded. Annexin C2-GFP did not accumulate at the wound site (n = 7). (F) A typical sequence of fluorescence images when a cell expressing annexin C1- GFP ruptured with 2.0 µm wound (arrows) in BSS (upper panels) and in the presence of EGTA (lower panels). Similar results were confirmed in 20 cells in each case. (G) Time courses of the fluorescence of Dd-GCaMP6s in annexin C1-null cells after wounding (0.5 µm wound). Each cell showed different irregular curves with multiple peaks (n = 7). The red dashed line is an averaged line in wild-type cells (from Fig. 3D) for comparison. (H) Time courses of PI influx in annexin C1 null cells (0.5 µm wound). The black solid line is an averaged line of 10 experiments (gray dots) and the red dashed line is an averaged line in wild-type cells (from Fig. 2B) for comparison. Bar, 10 µm.
