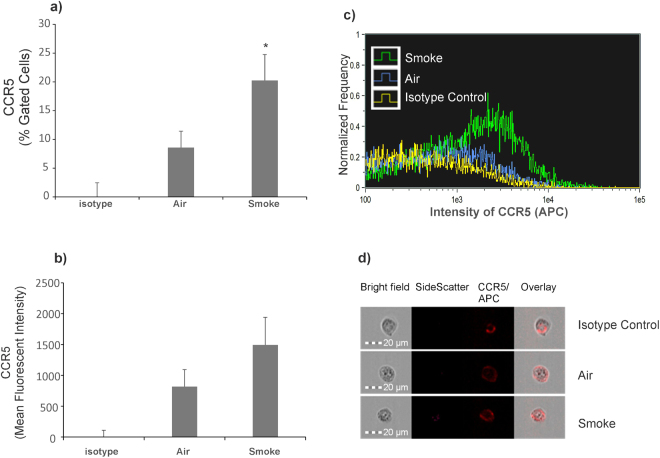
Figure 4.
Effect of CS exposure on CCR5 Cell surface receptor quantified by Single Cell Imaging flow cytometry. NHBE ALI cultures were exposed to CS. At the end of smoking, cells were immuno-stained with surface markers anti-human CCR5 labeled with APC. Percent Gated CCR5+ or APC+ cells for air NHBE (8.58 ± 2.85%) and smoke NHBE (20.25 ± 4.5%, P = 0.03) are represented (panel a). MFI of APC from in total population of cell images acquired (10,000 per sample) for air NHBE cells (818.74 ± 274.02) and smoked NHBE cells (1494.16 ± 447.95) are represented (panel b). Representative overlay histogram of intensity of APC for isotype control (yellow), air (blue) and smoke (green) (panel c). A representative single cell image for each sample is shown (panel d). Experiments were carried out from at least 3 different lungs. *Significant (p < 0.05).

