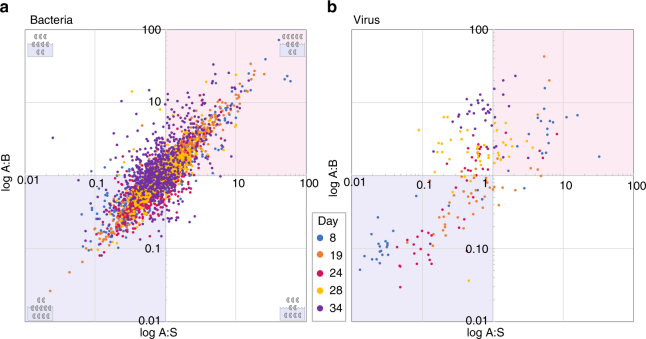
Fig. 2.
Aerosolization of bacterial and viral genomes across the blooms. The ratio of fraction of genomes in aerosols to the fraction in bulk (A:B) plotted against ratio of fraction of genomes in aerosols to those in sea surface microlayer (A:S) is shown for bacteria (a), and viruses (b), over the course of the experiment. The upper right quadrants (red) of a and b indicate genomes enriched in aerosol relative to both bulk and SSML (A:B and A:S > 1); the lower left quadrants (blue) indicates genomes that are primarily waterborne (A:B and A:S < 1). The upper left quadrants indicates genomes enriched relative to bulk but not SSML (A:B > 1, A:S < 1), and the lower right indicates species enriched in aerosol relative to the surface but not bulk (A:B < 1, A:S > 1). The data sets represent a 700 bacterial genomes and b 46 viral genomes identified by read-based taxonomic assignments filtered of genomes below abundance thresholds. Graphics in the corners various quadrants in a show examples of expected species ratios in indicated portion of graph

