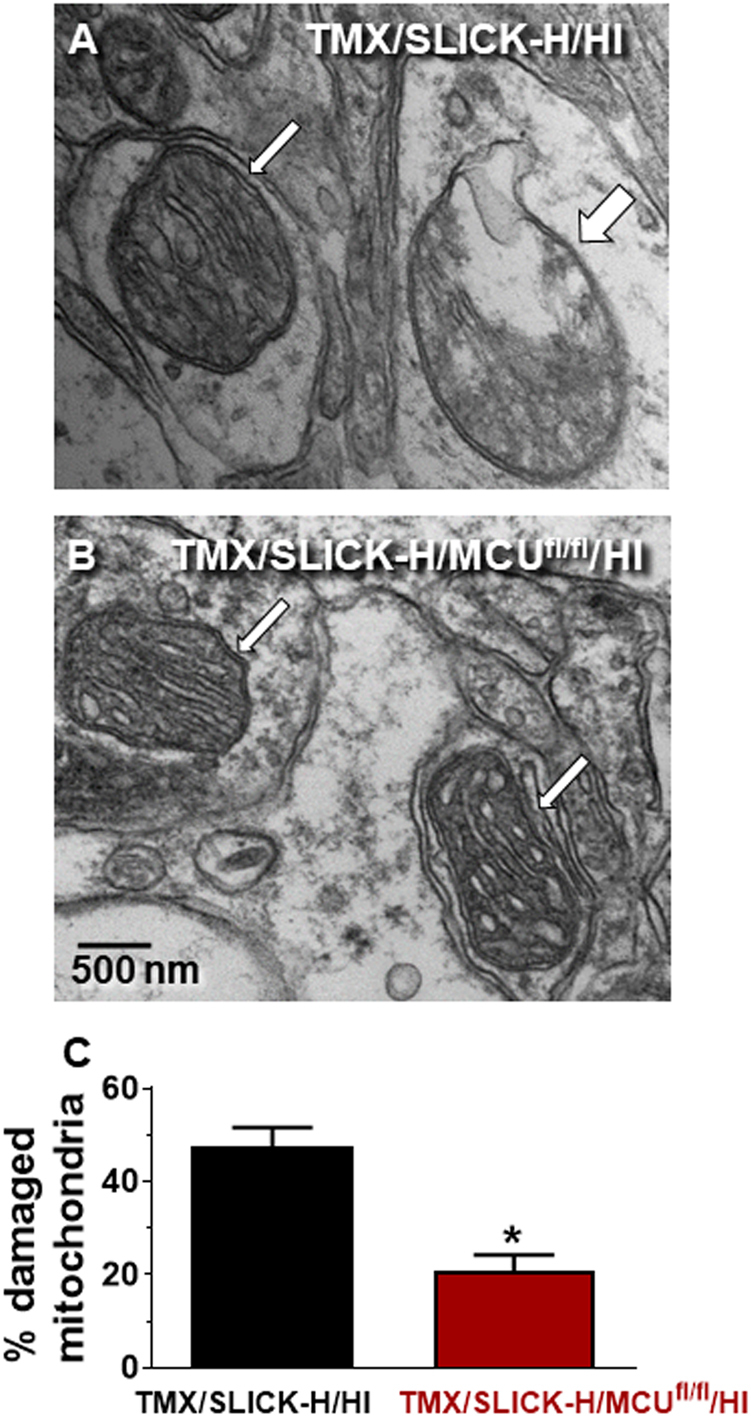
Fig. 4. Representative EM images showing intact (thin arrows) or damaged (thick arrow) mitochondria.

EM images of mitochondria within neurons of the CA1 region of the dorsal hippocampus 24 h after HI in a TMX/SLICK-H/HI (a) and TMX/SLICK-H/MCUfl/fl/HI mouse b. Quantification of mitochondrial damage in the CA1 region of the dorsal hippocampus 24 h after HI in TMX/SLICK-H/HI and TMX/SLICK-H/MCUfl/fl/HI mice, n = 5 (C). *p < 0.05 relative to TMX/SLICK-H/HI mice, Mann–Whitney U-test
