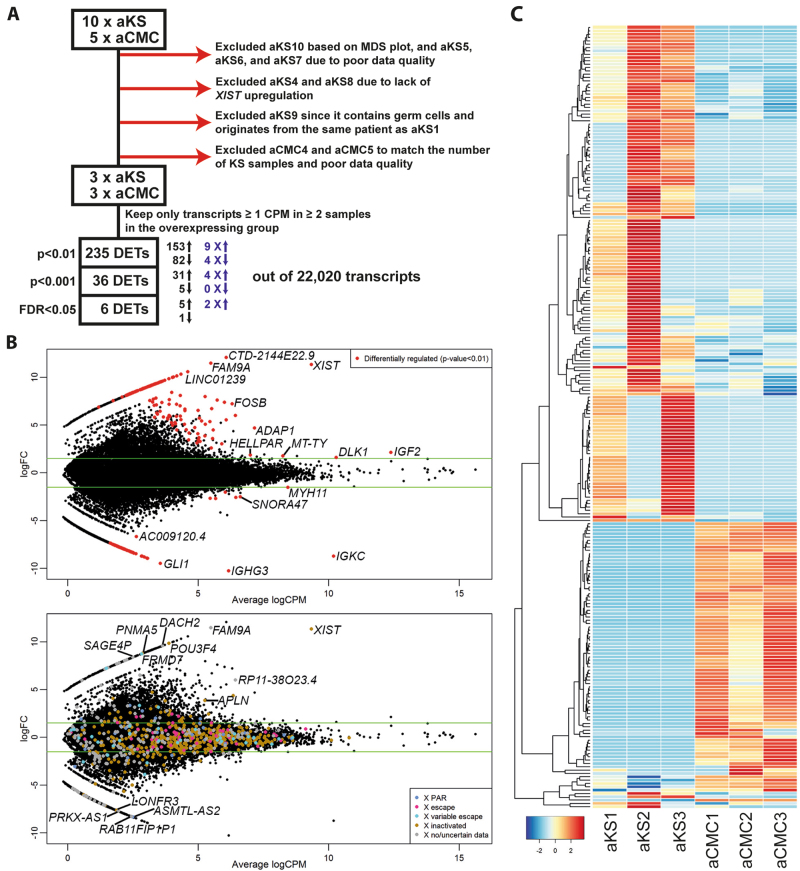
Fig. 1. Differentially expressed transcripts (DETs) in testis from adult Klinefelter syndrome (KS) patients compared to cellularity-matched control (CMC) testes.
a Flowchart depicting the exclusion of samples. b Top: Volcano plot with all expressed transcripts. The red dots are the DETs using an un-adjusted p-value < 0.01. The most significant DETs are indicated. Bottom: The same plot as on the top, but with all X-chromosomal transcripts plotted according to their X-chromosome inactivation status25. The significant X-chromosomal DETs are indicated. c Heatmap of the DETs

