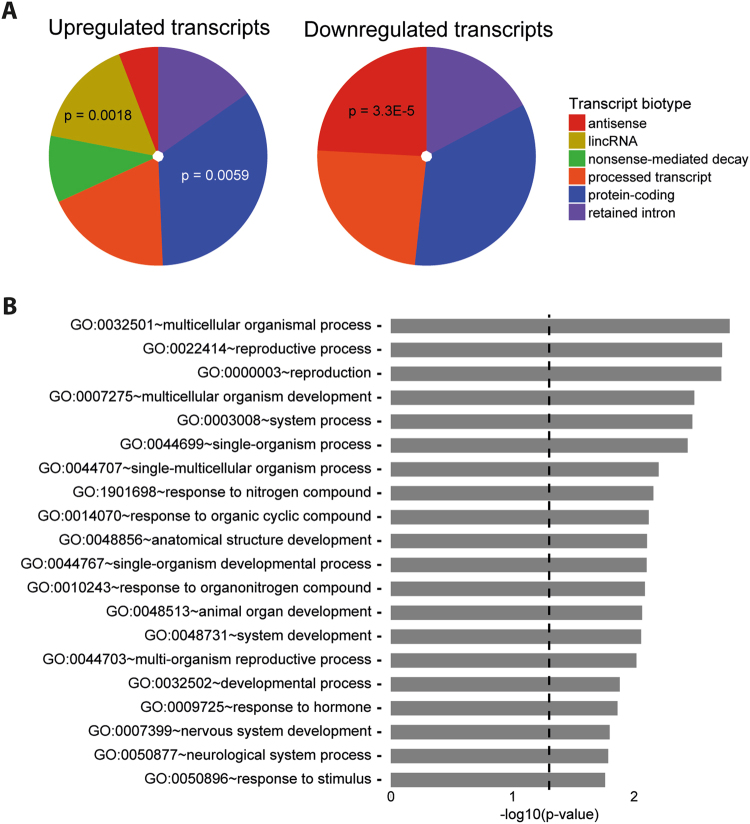
Fig. 4. Enrichment analyses of the differentially expressed transcripts (DETs).
a Distribution in RNA biotype among the upregulated (left) and downregulated (right) transcripts. The significant biotypes are indicated with p-values. For RNA biotypes of each individual DET, see Supplementary Tables S1 and S2, and for description of RNA biotypes, see Supplementary Table S4. b Significantly overrepresented gene ontology (GO) “Biological Process” terms of the DETs

