
Figure 3.
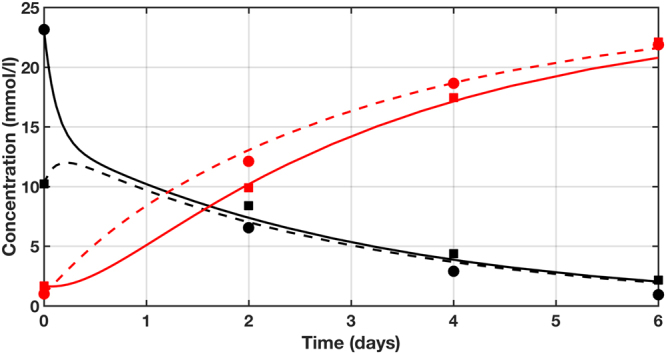
Computational modeling of glucose consumption and lactate production in the gut MPS. Data-driven mechanistic modeling of glucose (black) and lactate (red) in the gut MPS for the 6-day, no medium change experiment. Measurements (symbols) and simulation (lines) of concentrations in the apical side (solid lines; circles) and basal side (dashed lines; squares) of the gut MPS are shown. Triplicates were pooled together due to low apical volumes.