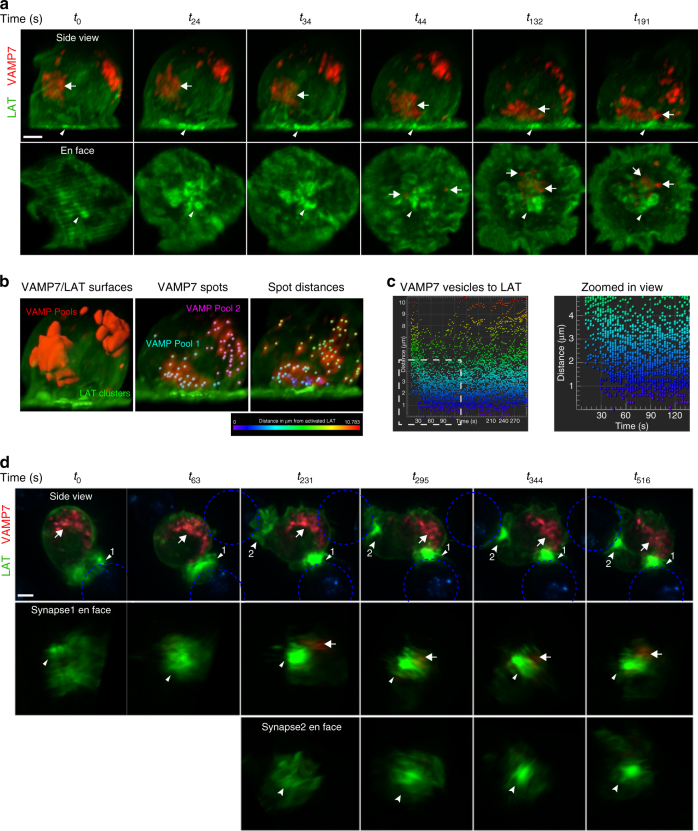
Fig. 3.
Spatial and temporal dynamics of LAT and VAMP7 visualized by lattice light sheet microscopy. a Jurkat cells transfected with LAT-neon green (green) and Halo-VAMP7 (red) were dropped onto stimulatory coverslips and imaged by lattice light sheet microscopy soon after activation. t0 indicates the first time point of image collection. The top panel shows the side view of the cell. The arrowhead indicates LAT microclusters and the arrow indicates VAMP7 vesicles that colocalize with vesicular LAT. Scale bar equals 2 μm. The bottom panel shows en face view of the activated surface (n = 5 cells, three independent experiments). b The left panel shows surfaces of LAT clusters (green) and VAMP7 vesicles (red). The middle panel shows individual vesicles marked as spots (cyan and pink) within VAMP7 surfaces. The panel to the right shows distances of VAMP7 spots from LAT clusters followed over time. The vesicles are color-coded to indicate distance in μm from activated LAT. c The panel to the left shows the graph of distances of individual VAMP7 vesicles from LAT clusters over time. Vesicles are color-coded to indicate distance in μm from activated LAT as in b. To the right is the zoomed-in view of the white boxed region indicated in the graph. d Jurkat cells transfected with LAT-neon green (green) and Halo-VAMP7 (red) were incubated with SEE-coated Raji B cells (blue) and immune synapse formation was visualized by lattice light sheet microscopy. t0 indicates the first time point of image collection. The top panel shows the side view of the cell. The arrowhead indicates LAT aggregated at immune synapse 1, and the arrow indicates VAMP7 vesicles. At t231, the T cells begin to interact with a second Raji B cell. The second synapse is indicated with an indented arrowhead (synapse 2). Scale bar equals 2 μm. The middle panel shows en face view of synapse 1 showing LAT accumulation at the immune synapse before the appearance of VAMP7 vesicles at t231. The bottom panel shows en face view of synapse 2 (n = 5 cells, three independent experiments). See also Supplementary Figure 2

